SAT Data - Graphs and Charts

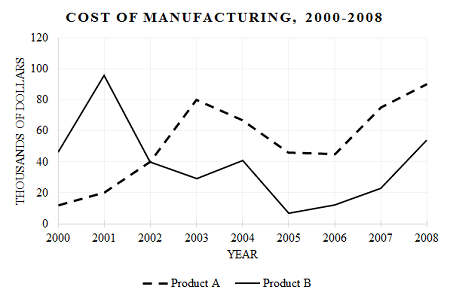
The graph above shows the cost of manufacturing of two products, A and B, per year. In which year was the difference in the cost of manufacturing the two products the greatest?

(A) 2001 \ \ 2001
(B) 2002 \ \ 2002
(C) 2003 \ \ 2003
(D) 2007 \ \ 2007
(E) 2008 \ \ 2008

A B C D E

This section requires Javascript.
You are seeing this because something didn't load right. We suggest you, (a) try refreshing the page, (b) enabling javascript if it is disabled on your browser and, finally, (c) loading the non-javascript version of this page . We're sorry about the hassle.

2 solutions

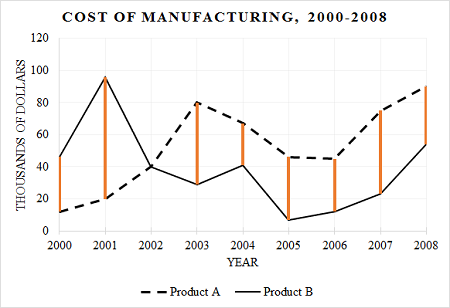
By visual inspection, we can see that the greatest difference in cost took place in the year 2001 2001 . The difference is approximately 100000 20000 = 80000 100000-20000=80000 .

Tatiana Georgieva Staff
Mar 18, 2015

Correct Answer: A

Solution 1:

On the graph, the difference in the cost of manufacturing is represented by the vertical distance between the two lines.

As can be seen below, the vertical distance in 2001 is the greatest.

Solution 2:

We can actually compute the difference in the cost of manufacturing for each of the choices.

In 2001, the cost of manufacturing for product B was about $98,000, and the cost of manufacturing for product A was about $20, 000. The difference is about $78,000.

In 2002, the cost of manufacturing for both products was the same, $40, 000. The difference is $0.

In 2003, the cost of manufacturing for product A was about $80,000, and the cost of manufacturing for product A was about $30, 000. The difference is about $50,000. In the same way, we conclude that the difference in the cost of manufacturing the two products in 2007 is about $50, 000, and in 2008 it is about $30, 000.

The difference in cost of manufacturing is greatest in 2001.


Incorrect Choices:

(B) , (C) , (D) , and (E)
It is evident from the graph in the Solution 1 that the vertical distance between the two lines in these choices is smaller than that in choice B. Solution 2 actually computes the difference for each year.

0 pending reports

×

Problem Loading...

Note Loading...

Set Loading...