A dove for all occasions
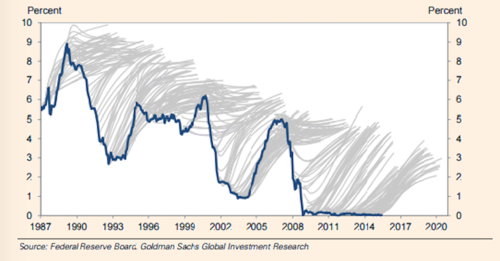 The blue curve in the above plot shows the interest rate for short-term loans set by the United States Federal Reserve Bank. As you can see, the rate has a long term downward trend, and has been near zero since 2009. The gray curves show projections for the future value of the short-term rate from the forward curve. What can we say about the forward projections vs the actual short-term interest rate set by the Fed?
This section requires Javascript.
You are seeing this because something didn't load right. We suggest you, (a) try
refreshing the page, (b) enabling javascript if it is disabled on your browser and,
finally, (c)
loading the
non-javascript version of this page
. We're sorry about the hassle.
The curve is clearly overestimating since it is above our trend line.
Blue curve seems to go downn.