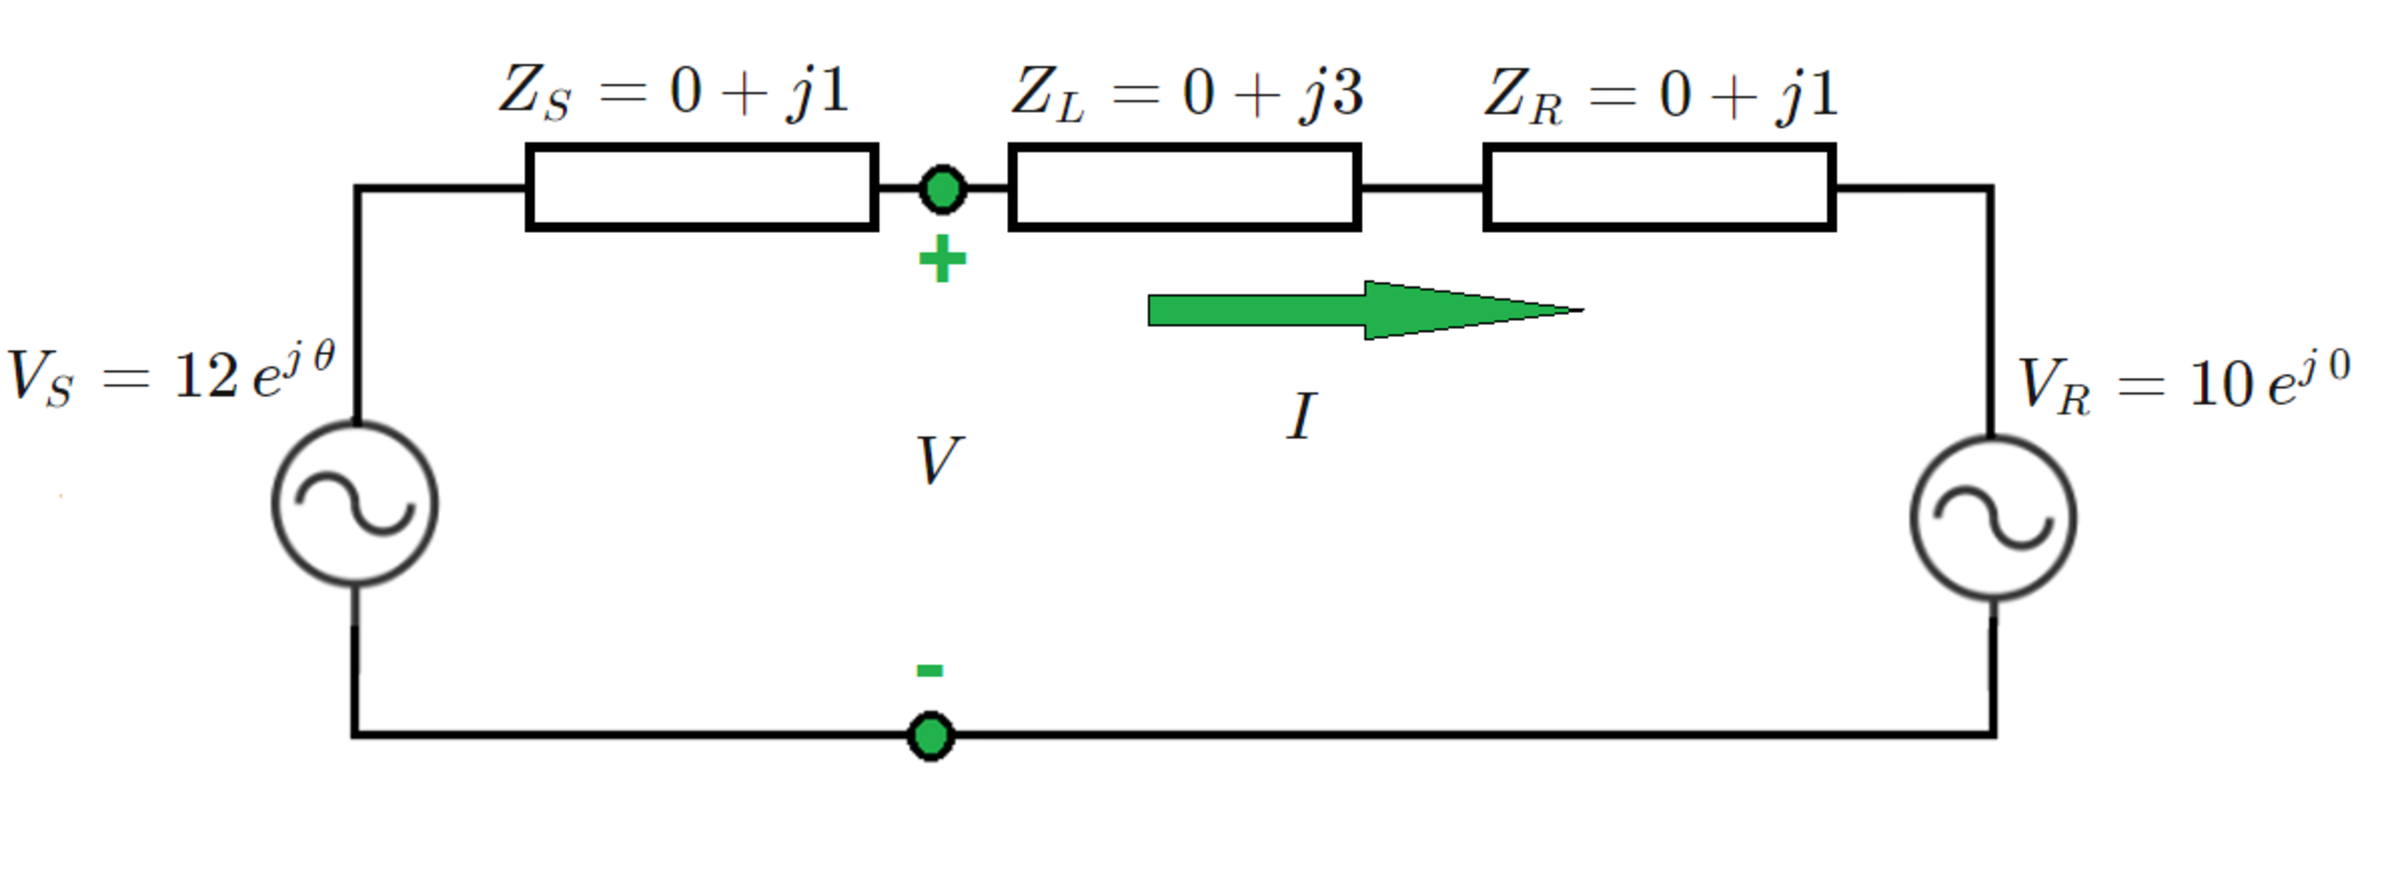
AC Swing Impedance
Let . This is the apparent impedance looking to the right of the green dots. For in the range , make a two-dimensional plot of the locus of , with the real part of on the horizontal axis, and the imaginary part of on the vertical axis.
What is the area enclosed by the resulting curve?
Note: The variable angle is the angle of the source on the left
The answer is 584.2.
This section requires Javascript.
You are seeing this because something didn't load right. We suggest you, (a) try
refreshing the page, (b) enabling javascript if it is disabled on your browser and,
finally, (c)
loading the
non-javascript version of this page
. We're sorry about the hassle.
0 solutions
No explanations have been posted yet. Check back later!