Area and Volume
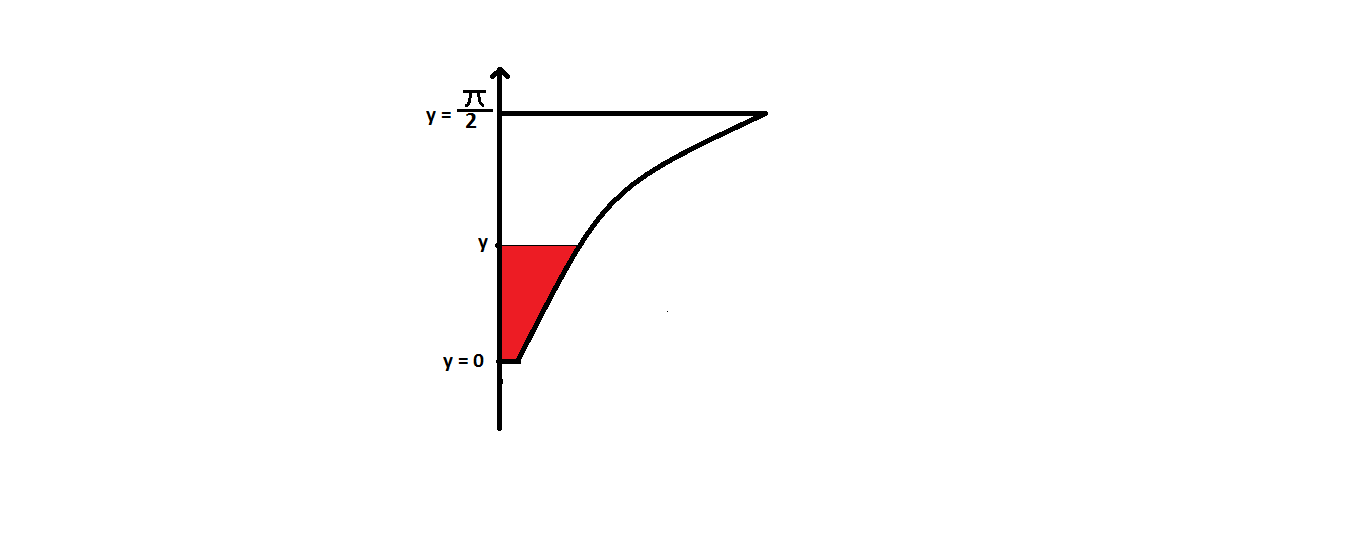
 In the above diagram(diagram is not upto scale),there is a plate with one edge as straight line along y-axis and other side as random curve.
is defined as the area of the sheet from
y = 0
to
y
(red region in the diagram).
is defined as the volume of the solid formed ,from
y = 0
to
y
, when this sheet is rotated about y-axis.If
= + for any variable y .
Find at y =
This section requires Javascript.
You are seeing this because something didn't load right. We suggest you, (a) try
refreshing the page, (b) enabling javascript if it is disabled on your browser and,
finally, (c)
loading the
non-javascript version of this page
. We're sorry about the hassle.
Let A y = ∫ 0 y f ( y ) d y and V y = ∫ 0 y π ⋅ f ( y ) 2 d y . If V y = A y + A y 2 , then let us solve for the function f ( y ) by differentiating both sides with respect to y :
∂ y ∂ ⋅ V y = ∂ y ∂ ⋅ ( A y + A y 2 ) ⇒ π f ( y ) 2 = f ( y ) + 2 f ( y ) ⋅ ∫ 0 y f ( y ) d y ;
or π f ( y ) = 1 + 2 ⋅ ∫ 0 y f ( y ) d y ;
or 2 π f ( y ) − 1 = ∫ 0 y f ( y ) d y (i); with the initial condition f ( 0 ) = π 1 at y = 0 .
Now differentiating (i) with respect to y yields 2 π f ′ ( y ) = f ( y ) ⇒ f ( y ) f ′ ( y ) = π 2 ⇒ l n ∣ f ( y ) ∣ = π 2 y + C
and the initial condition f ( 0 ) = π 1 ⇒ C = l n ( π 1 ) , which finally results in f ( y ) = π 1 e π 2 y .
We now solve for A y V y at y = 2 π , or:
A y V y = A y A y + A y 2 = 1 + A y = 1 + ∫ 0 2 π π 1 e π 2 y d y ;
or 1 + 2 1 e π 2 y from 0 ≤ y ≤ 2 π ;
or 2 e + 1 ≈ 1 . 8 5 9