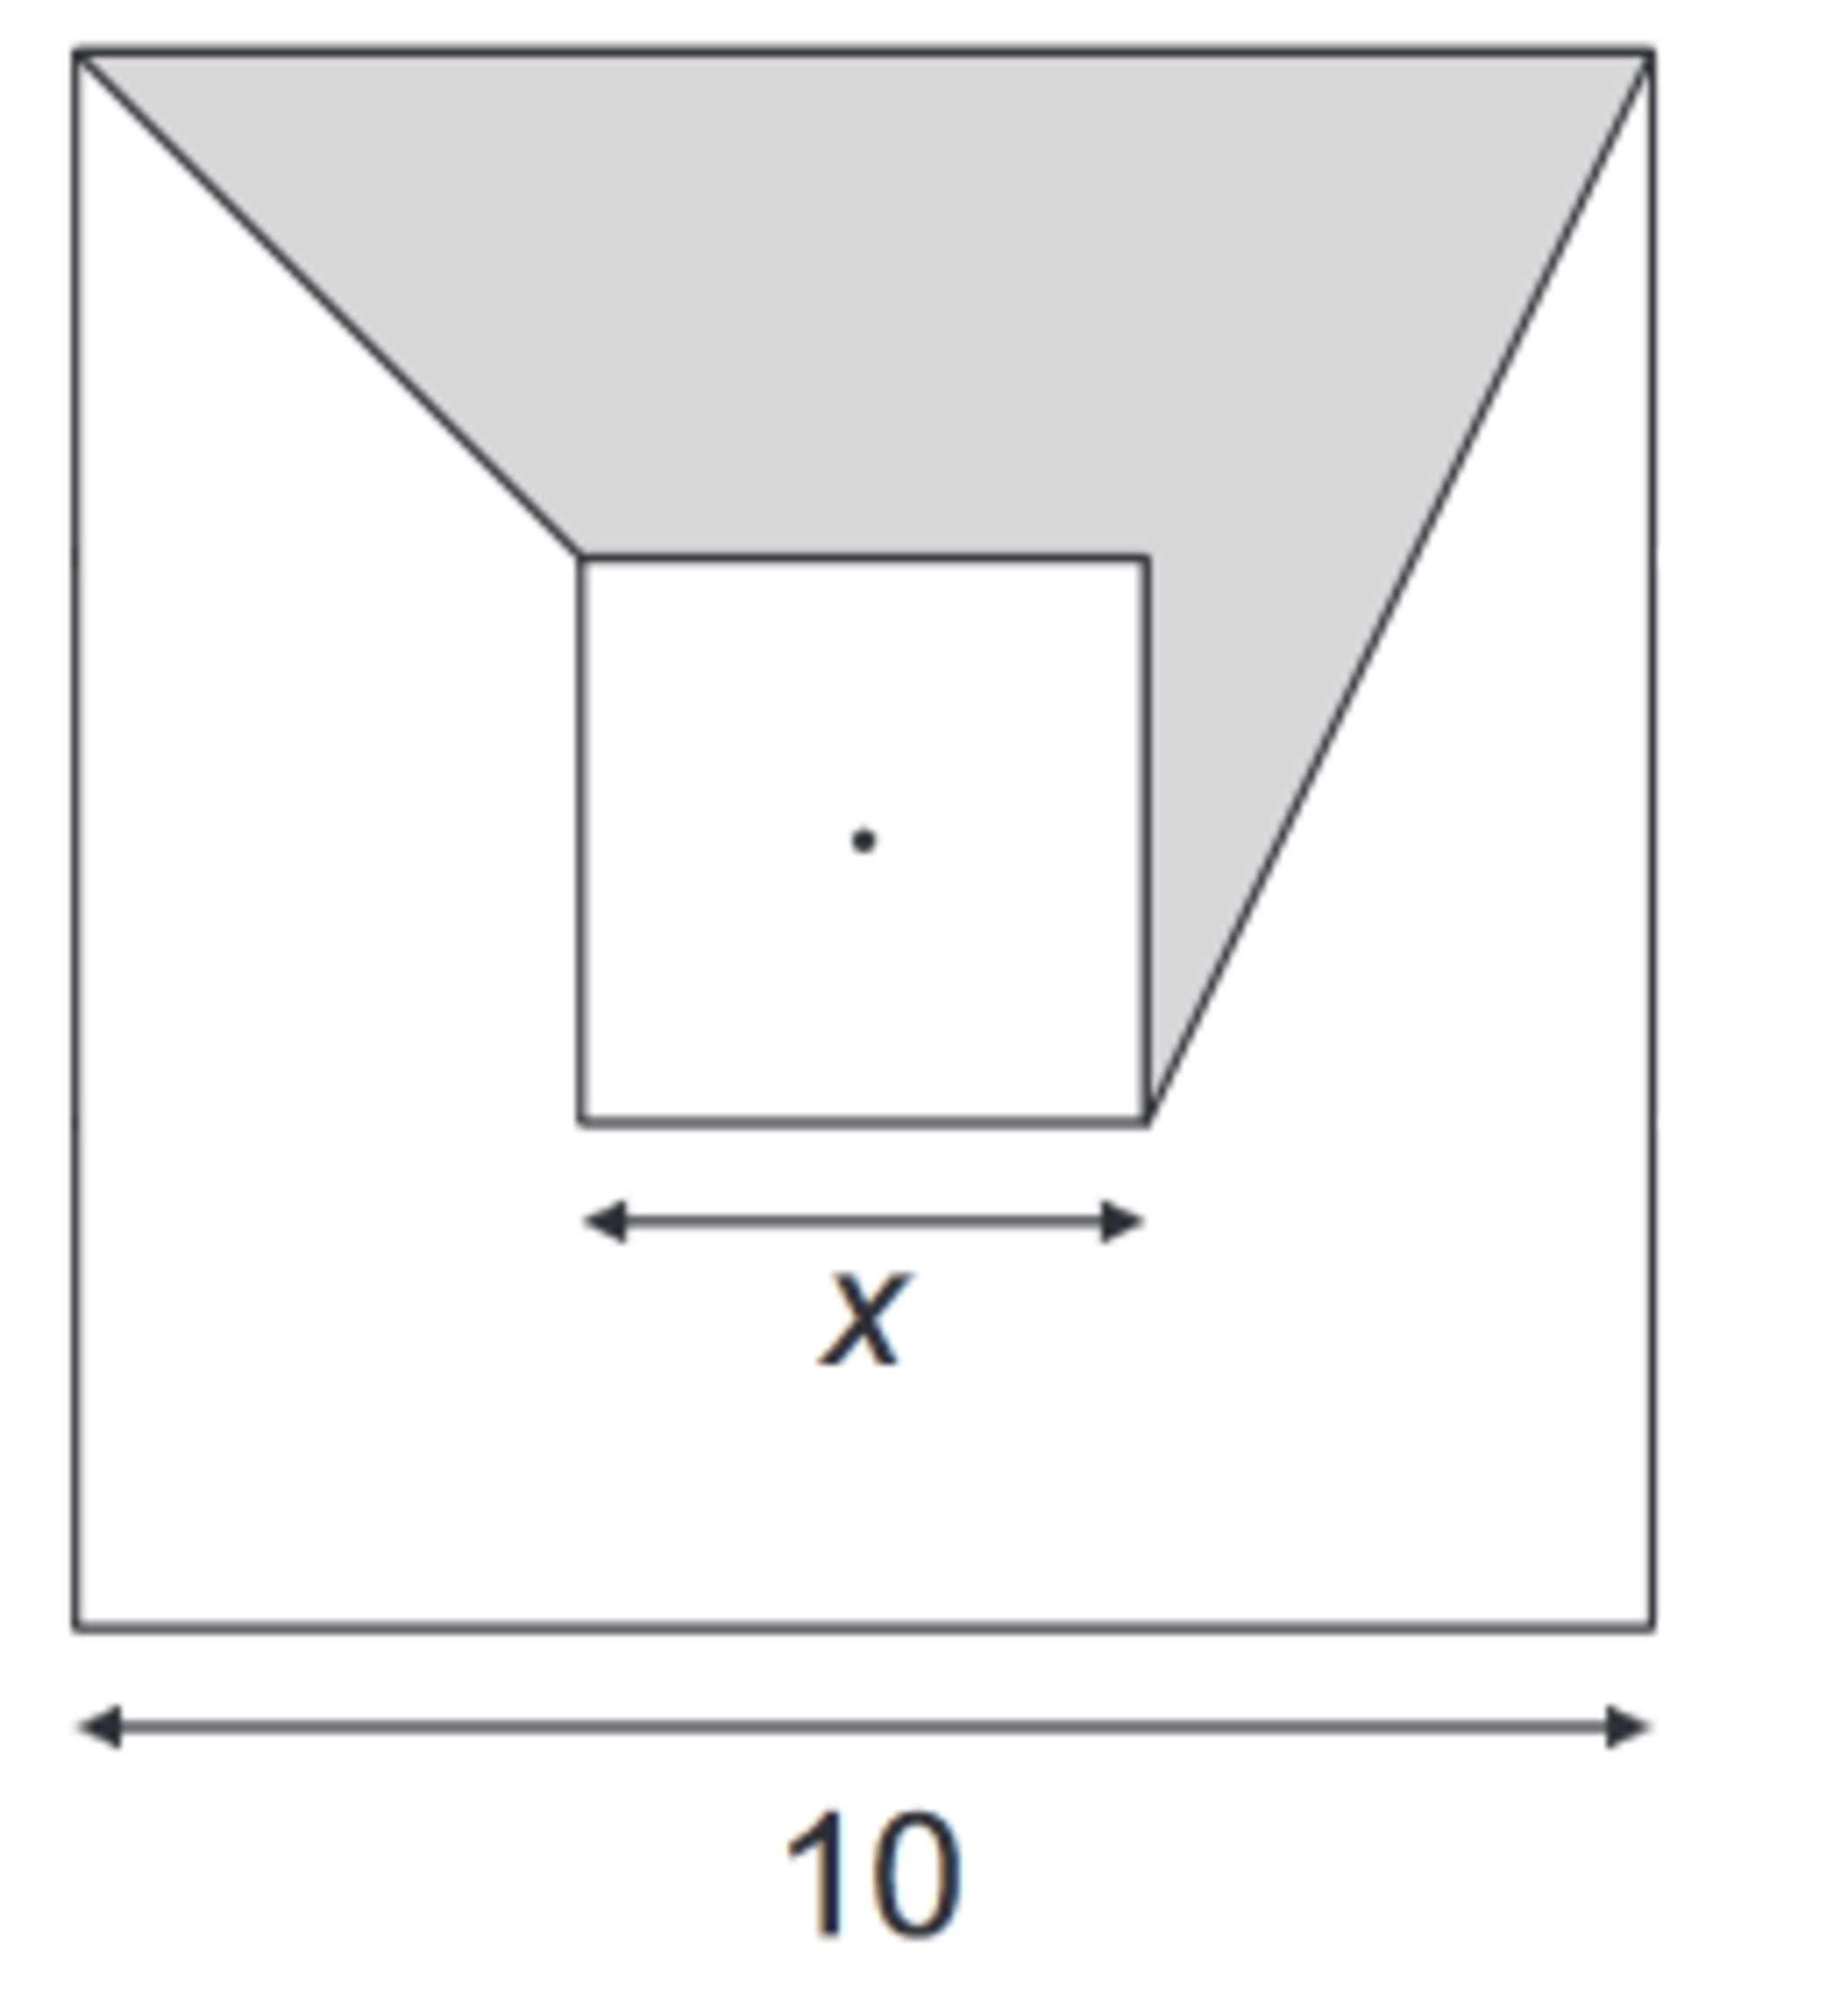
Area Function

The squares of the figures has parallel sides and the same center. The larger square has a side length of 10 and the smaller square has a side length of x . . The graph that better plot the function of the area of the gray region in function of X is:

This section requires Javascript.
You are seeing this because something didn't load right. We suggest you, (a) try
refreshing the page, (b) enabling javascript if it is disabled on your browser and,
finally, (c)
loading the
non-javascript version of this page
. We're sorry about the hassle.
Let the gray area in question be the sum of the areas of a trapezoid and a right triangle according to:
Trapezoid: Height = (10-x)/2, Base 1 = x, Base 2 = 10 - (10-x)/2 = 5 + x/2.
Triangle: Base = (10-x)/2, Height = x + (10-x)/2 = 5 + x/2.
So now the gray area as a function of x computes to:
A(x) = (1/2) [(10-x)/2] [x + (5 + x/2)] + (1/2) [(10-x)/2] (5 + x/2);
or A(x) = [(10-x)/4] * (5 + 3x/2) + [(10-x)/4] * (5 + x/2);
or A(x) = [(10-x)/4] * (10 + 2x);
or A(x) = (1/2) (10 - x)(5 + x) = (1/2) (50 + 5x - x^2);
or A(x) = -(1/2)*(x^2 - 5x) + 25;
or A(x) = -(1/2)*(x^2 - 5x + 25/4) + 25/8 + 25 (completing the square);
or A(x) = -(1/2)*(x - 5/2)^2 + 225/8
which is a concave-down parabola with vertex at (5/2, 225/8). Graph (B) is therefore the best choice.