Graphical Second Derivative
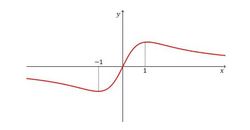 Given the graph of
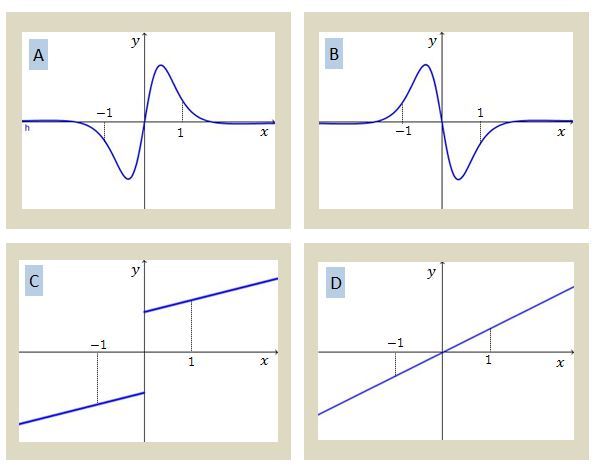
above, which of the following is a possible graph of
Given the graph of
above, which of the following is a possible graph of
This section requires Javascript.
You are seeing this because something didn't load right. We suggest you, (a) try
refreshing the page, (b) enabling javascript if it is disabled on your browser and,
finally, (c)
loading the
non-javascript version of this page
. We're sorry about the hassle.
Observe that the graph of y = f ( x ) is concave up for x < 0 , implying f ′ ′ ( x ) > 0 for x < 0 . Similarly, the graph of y = f ( x ) is concave down for x > 0 , implying f ′ ′ ( x ) < 0 for x > 0 . Only graph B meets these conditions, implying B is the only possible graph of f ′ ′ ( x ) .