Data Presentation: Box Plots 2
Probability
Level
2
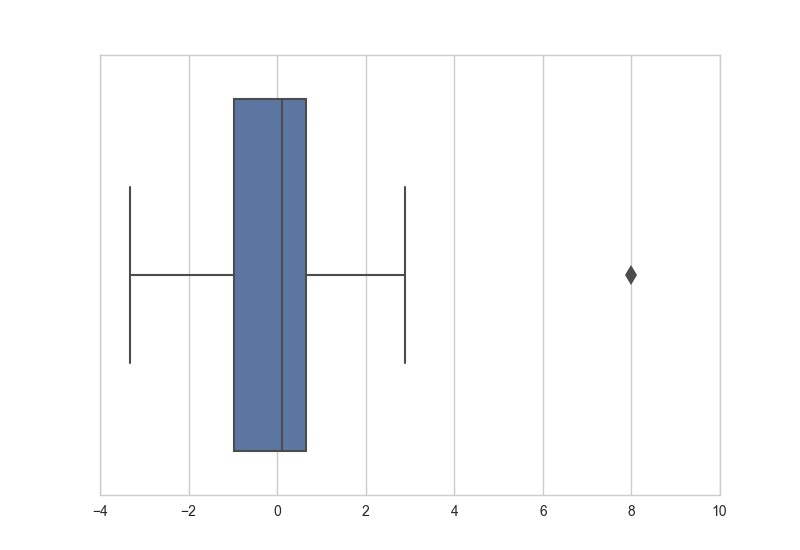 The box plot above represents a series of measurements. Which is closest to the largest measurement?
0.5
3
4
6
8
This section requires Javascript.
You are seeing this because something didn't load right. We suggest you, (a) try
refreshing the page, (b) enabling javascript if it is disabled on your browser and,
finally, (c)
loading the
non-javascript version of this page
. We're sorry about the hassle.
Outliers are represented in a box plot by dots either to the right or to the left of the majority of the data. In this case, there is one outlier at 8. Since all the other values fit into the -1 to 3 range, this means that 8 is the largest measurement in the data.