Enjoying the View of a Sinusoidal Canyon, Pt. 2
Before attempting this one, you might want to try out this problem first.
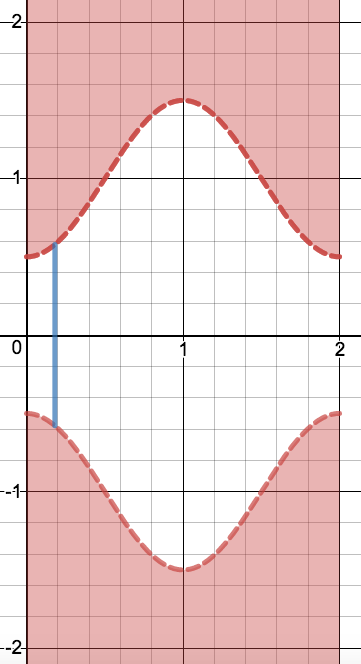
The rim of a canyon is defined as the curve f ( x ) = ± ( 2 1 sin ( π ( x − 2 1 ) ) + 1 ) with x ∈ [ 0 , 2 ] (red dotted curve in the image below). You wish to build a bridge over the canyon at x = t , − ∣ f ( t ) ∣ ≤ y ≤ ∣ f ( t ) ∣ (blue line in the image below) for some 0 ≤ t ≤ 1 .
Enter t such that it maximizes the proportion of the length of the bridge from which you can see all parts of the canyon.
Note and Assumptions
- The finished bridge will have zero thickness and will be perfectly stationary. Assume that, while sightseeing, you won't fall off the bridge.
- You are able to see all parts of the canyon if, for any point on f ( x ) , the line segment between you and the point does not intersect any other part of the curve f ( x ) .
 Graph created with Desmos
Bonus
What is the maximum proportion of length possible from which you can see all parts of the canyon for any straight bridge (not necessarily vertical)?
The answer is 0.18169011.
This section requires Javascript.
You are seeing this because something didn't load right. We suggest you, (a) try
refreshing the page, (b) enabling javascript if it is disabled on your browser and,
finally, (c)
loading the
non-javascript version of this page
. We're sorry about the hassle.
2 solutions
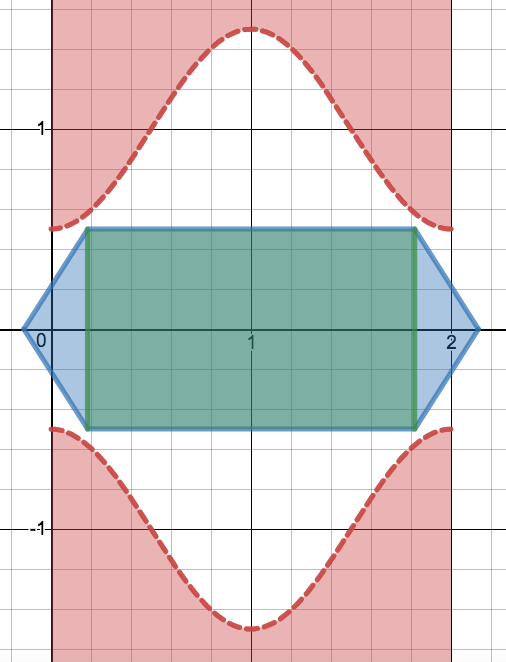
One should realize that the area in which one can see all parts of the canyon is inside of max ( − 2 1 , − 2 π x − 1 + 4 π , 2 π x − 1 − 4 3 π ) ≤ y ≤ min ( 2 1 , 2 π x + 1 − 4 π , − 2 π x + 1 + 4 3 π ) . The reason is that there are eight points of curve f ( x ) to consider: ( 0 , ± 2 1 ) , ( 2 , ± 2 1 ) , ( 2 1 , ± 1 ) , and ( 2 3 , ± 1 ) (essentially the least steepest and steepest points on the curve; you might want to look at the solution to part 1 of this question to understand why and how the points and the equations were derived).
 Graph created with Desmos
Now, obviously, the bridge cannot be made where t < 0 and t > 2 . In addition, it cannot be made in the green region, as the length in which one can view all parts of the canyon stays constant while the length of the bridge increases.
Since t ≤ 1 , we just have to consider building the bridge in the blue region to the left. Then, t ≤ 2 1 − π 1 (the x-coordinate of the intersection of 2 π x + 1 − 4 π and 2 1 ). One can try to find the proportion of the length of the bridge where one can see the whole canyon as a function of t and find where the maximum occurs.
However, an easier way is to realize that f ( x ) has a smaller slope than 2 π x + 1 − 4 π for 0 ≤ t ≤ 2 1 − π 1 . In other words, the length of the bridge where one can see the whole canyon increases faster than the length of the bridge itself. This implies that the proportion of the length of the bridge from which one can view the whole canyon is always increasing (use quotient rule or the fact that, for positive n , d , k where n ≤ d , d n ≤ d + k n + k ), until t = 2 1 − π 1 .
The image below shows the top rim of the canyon; the light green lines are the tangents to the curve at the inflection points (i.e. the steepest tangent lines) and the dark green line is the tangent to the lowest points on the top rim.
In order to see the entire canyon, one has to be positioned below both the light green and the dark green lines, i.e outside of the cross-hatched region. Any bridge we build will cross that cross-hatched region; we claim that in order to minimize the proportion of the bridge in the cross-hatched region, we should draw the bridge through the intersection of the light green and dark green tangent lines.
If the bridge is built to the right of this intersection point, clearly the part of it in the cross-hatched region will increase, but the part outside the cross-hatched region will remain the same, so the proportion of the bridge in the cross-hatched section will increase. If the bridge is built to the left of the intersection point, the part of it in the cross-hatched region will again increase (because the light green tangent line will be steeper than the tangent to the curve at the same x-coordinate) but the part outside the cross-hatched region will decrease, so the proportion of the bridge in the cross-hatched section will again increase.
From the solution of Enjoying the View of a Sinusoidal Canyon, Pt.1 , we know the equation of the light green tangent line is y − 1 = 2 π ( x − 2 1 ) , and the equation of the dark green tangent line is clearly y = 2 1 . Solving for the intersection point, we find that x = 2 1 − π 1