Filling containers and graphics
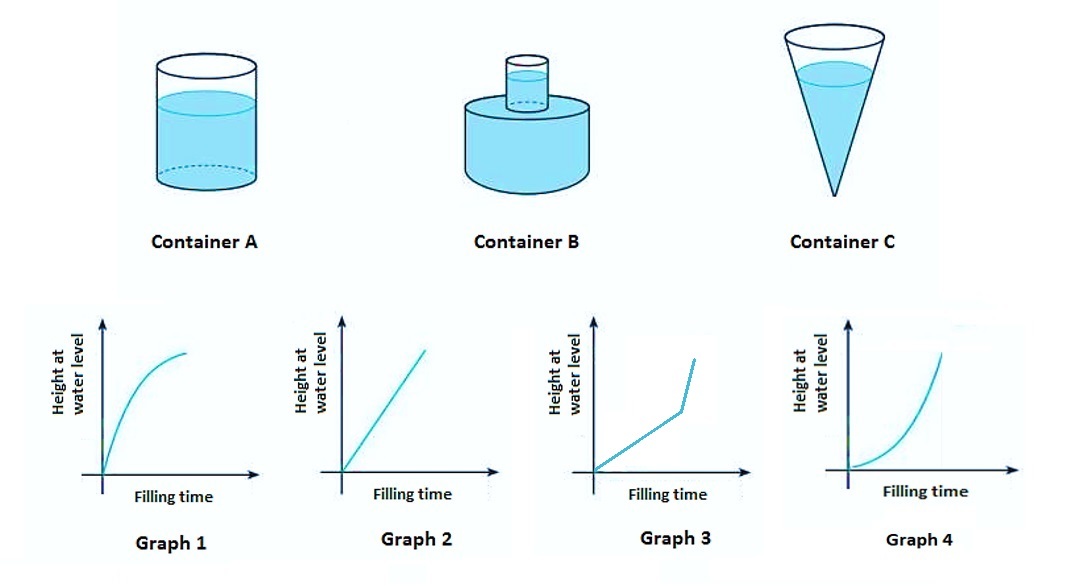
The graphs shown represent the variation of the height in the water level of each container with respect to the time elapsed. Which graph does not correspond to any of the three vessels considering that the volumetric flow rate is constant?

This section requires Javascript.
You are seeing this because something didn't load right. We suggest you, (a) try
refreshing the page, (b) enabling javascript if it is disabled on your browser and,
finally, (c)
loading the
non-javascript version of this page
. We're sorry about the hassle.

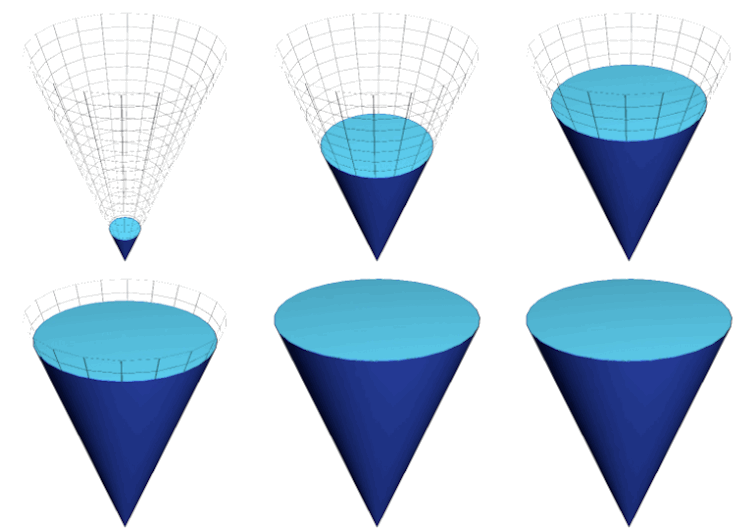
The derivative of the water height represents the cross-sectional area of the container at that height. There is no container here with a cross-sectional area that is continuously increasing with height, as suggested by graph 4. Fun problem!