Frequency response - Bode plot 1
A Bode plot is a way of analyzing how a system will behave for inputs with a wide range of frequencies. One may want to analyze how much will the input scale or how will the phase change as the frequency changes.
To plot the graph for the scale we graph in the y-axis where is the scale factor of the input, and we have on the x-axis where is the frequency of the input. The logarithm is pretty convenient when dealing with systems.
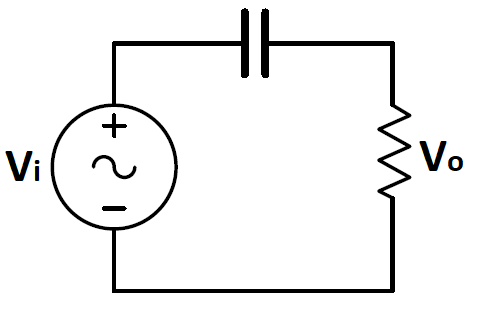
Consider the circuit below, what would you expect to be the bode plot for it if is your input and is your output?

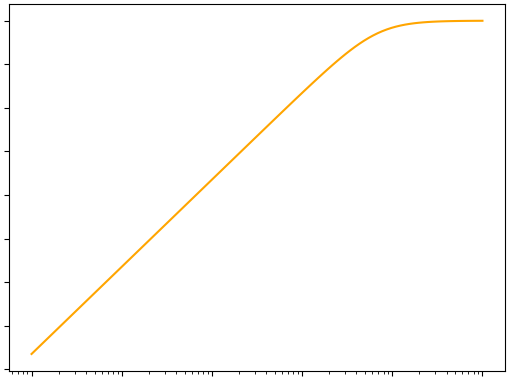
A)

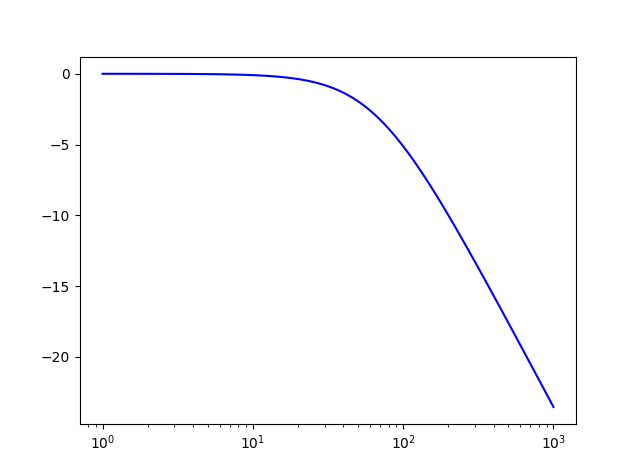
B)

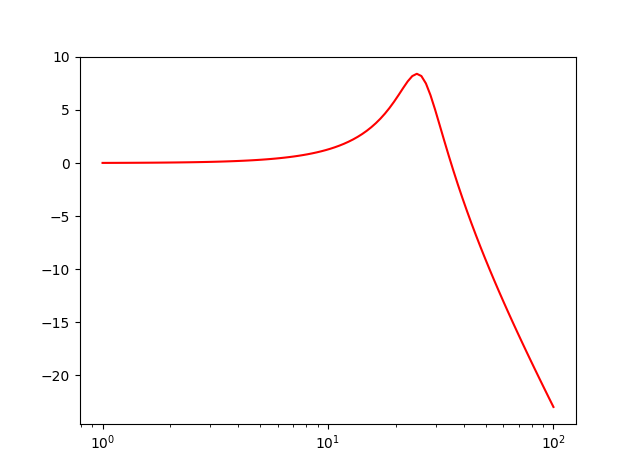
C)

D)

This section requires Javascript.
You are seeing this because something didn't load right. We suggest you, (a) try
refreshing the page, (b) enabling javascript if it is disabled on your browser and,
finally, (c)
loading the
non-javascript version of this page
. We're sorry about the hassle.
The capacitor and the resistor form a voltage divider, so V o = V i R + C ⋅ j ω 1 R the input will be scaled by a factor of R + C ⋅ j ω 1 R , it's easy to see that, as the frequency ω goes to zero, our scale factor will go to zero, it is also easy to see that as our frequency goes to infinity, it will go to 1 , the only graph that resembles it here is the one on A.