Have you had an annual check-up?

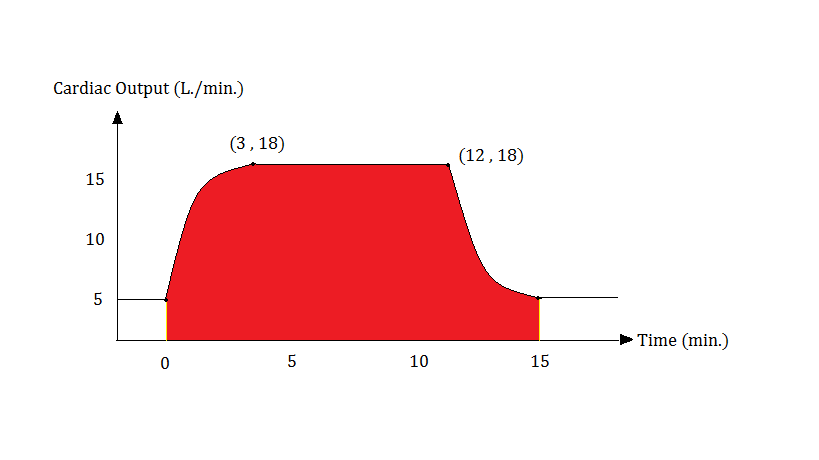
During an exercise stress test, a patient's cardiac output (C.O.) was monitored throughout the 15-minute exercise period while the resting C.O. was 5 L/min.
As shown in the diagram, for t<3, the C.O. correlated to the function:
f(t) = - 8.
From t=3 to t=12, the C.O. reached a plateau with a function:
f(t) = 18.
When t>12, the patient slowed his pace down, and the function during recovery phase was:
f(t) = + 31.
What is the average C.O. during this exercise period in L/min.?
Hint : You may not need a calculator for this.
The answer is 15.4.
This section requires Javascript.
You are seeing this because something didn't load right. We suggest you, (a) try
refreshing the page, (b) enabling javascript if it is disabled on your browser and,
finally, (c)
loading the
non-javascript version of this page
. We're sorry about the hassle.
Notice that the functions when t<3 and t>12 have opposite +/- sign of the main variables to each other and have the equal domain of 3. In other words, if we add the areas under curve of these 2 domains, the area from x=0 to x=3 will equal to
∫[ 1 + e − 2 t 2 6 - 8 + ( 1 + e − 2 ( t ) − 2 6 + 31)] dt = ∫ 23 dt = 23t.
That is the total area has been shifted to form a function of a constant, and so the total area under curve has become area of simple rectangles, as shown in figure 2.
As a result, we can calculate the new version of area under curve as:
3 × 2 3 + 1 8 × ( 1 2 − 3 ) = 69+162 = 231 L.
Finally, the average C.O. over the 15-minute period = 231/15 = 15.4 L./min.