How do you make a bean?
Geometry
Level
3
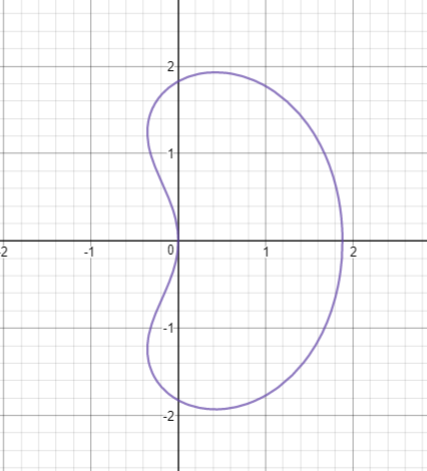
The graph shows a curve in the form of a bean. Which equation produces the curve?
Image: Credits to Desmos graphing calculator
This section requires Javascript.
You are seeing this because something didn't load right. We suggest you, (a) try
refreshing the page, (b) enabling javascript if it is disabled on your browser and,
finally, (c)
loading the
non-javascript version of this page
. We're sorry about the hassle.
We can use some known points to rule out options. We know from the graph that there must be three unique real solutions for y when x = 0 , which are y = 0 and y ≈ ± 1 . 8 ; this immediately rules out three options by inspection, leaving 0 . 3 ( x 2 + y 2 ) 2 = 2 x + y 2 and 0 . 3 ( x 2 + 2 y 2 ) 2 = x + 4 y 2 as possibilities. We also know that there must be two unique solutions for x when y = 0 , namely x = 0 and x ≈ 1 . 8 5 . Setting y = 0 gives us 0 . 3 x 4 = 2 x and 0 . 3 x 4 = x respectively; only the first has x ≈ 1 . 8 5 as a solution, so it must be the answer.