How many satisfied values?
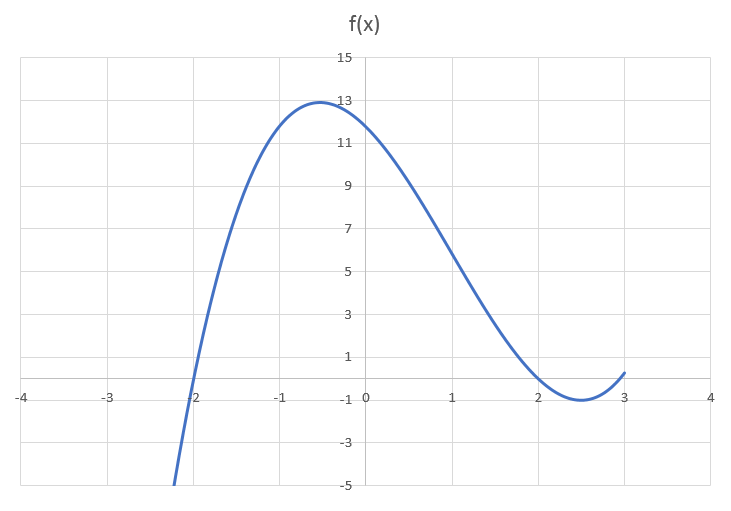
Let y = f ( x ) be a cubic function with the graph shown below.

How many real values of x such that ∣ ∣ f ( x 3 − 3 x ) ∣ ∣ = 3 2 ?
This section requires Javascript.
You are seeing this because something didn't load right. We suggest you, (a) try
refreshing the page, (b) enabling javascript if it is disabled on your browser and,
finally, (c)
loading the
non-javascript version of this page
. We're sorry about the hassle.
2 solutions
From the graph, we know three things:
1)
The cubic has a root at
x
=
2
2)
The cubic has a root at
x
=
−
2
3)
The function has a value of
−
1
when the derivative of the function is zero
The following form results:
f ( x ) = ( x − 2 ) ( x + 2 ) ( x − a ) f ( x ) = x 3 − a x 2 − 4 x + 4 a f ′ ( x ) = 3 x 2 − 2 a x − 4
Find an ( x , a ) pair which solves the following equations:
− 1 = x 3 − a x 2 − 4 x + 4 a 0 = 3 x 2 − 2 a x − 4
Solving using multi-variate Newton Raphson gives:
( x , a ) ≈ ( 2 . 4 9 6 9 , 2 . 9 4 4 4 )
The plot of f ( x ) is below:

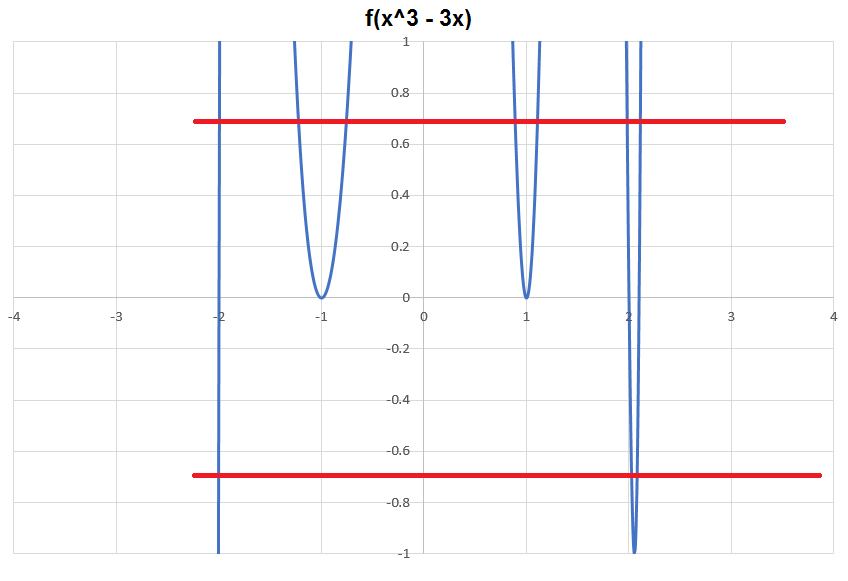
The plot of f ( x 3 − 3 x ) is below. The magnitude is equal to 3 2 ten times

Excellent graphs. How did you make them ? I mean which software did you use ?
Thanks. I made them in Excel, and then took screenshots and pasted into Microsoft Paint. For the second graph, I added the red lines in Paint. In general, for more complex graphs (of which there have been many), I print x,y coordinates from a Python terminal and import into Excel as a scatter plot.
I've also wondered how you create your impressive graphics and animations (software-wise)
Log in to reply
I exclusively use MS-Excel Chart utility, mostly coupled with MS Visual Basic for Applications Programming Language (Macro Environment).
How did you solve for (x,a)?
You have to be careful here-- f ( x ) may not be a monic cubic. I don't think it's unique.
Anyway, you don't need to solve for f ( x ) to get the answer to the problem.
Let's change variables for clarity, and solve ∣ f ( t 3 − 3 t ) ∣ = 3 2 .
First let's look at the solutions to ∣ f ( x ) ∣ = 3 2 . Drawing horizontal lines at y = ± 2 / 3 in the above graph, there are six x -coordinates of intersection. One of them is in the interval ( − ∞ , − 2 ) , two of them are in the interval ( − 2 , 2 ) , and three of them are in the interval ( 2 , ∞ ) . So t 3 − 3 t is one of these six values.
Now drawing the graph of x = t 3 − 3 t and doing the same horizontal line test shows that there are three values of t for any x in ( − 2 , 2 ) , and one value of t for any x in ( − ∞ , − 2 ) and any x in ( 2 , ∞ ) . So the total number of solutions is 3 ⋅ 2 + 1 ⋅ 4 = 1 0 .