How to lead the transformations of public organizations from traditional to Exponential?
Exponential Technologies are those which are rapidly accelerating and shaping major industries and all aspects of our lives, acording to the Singularity University.
Exponential technologies include artificial intelligence (AI), augmented and virtual reality (AR, VR), data science, digital biology and biotech, medicine, nanotech and digital fabrication, networks and computing systems, robotics, and autonomous vehicles.
We already adapted the Organizational Responsibility Model to Be Exponential with NetLogo:
http://www.netlogoweb.org/launch#http://ccl.northwestern.edu/netlogo/community/Organizational%20Responsibility%20Model.nlogo
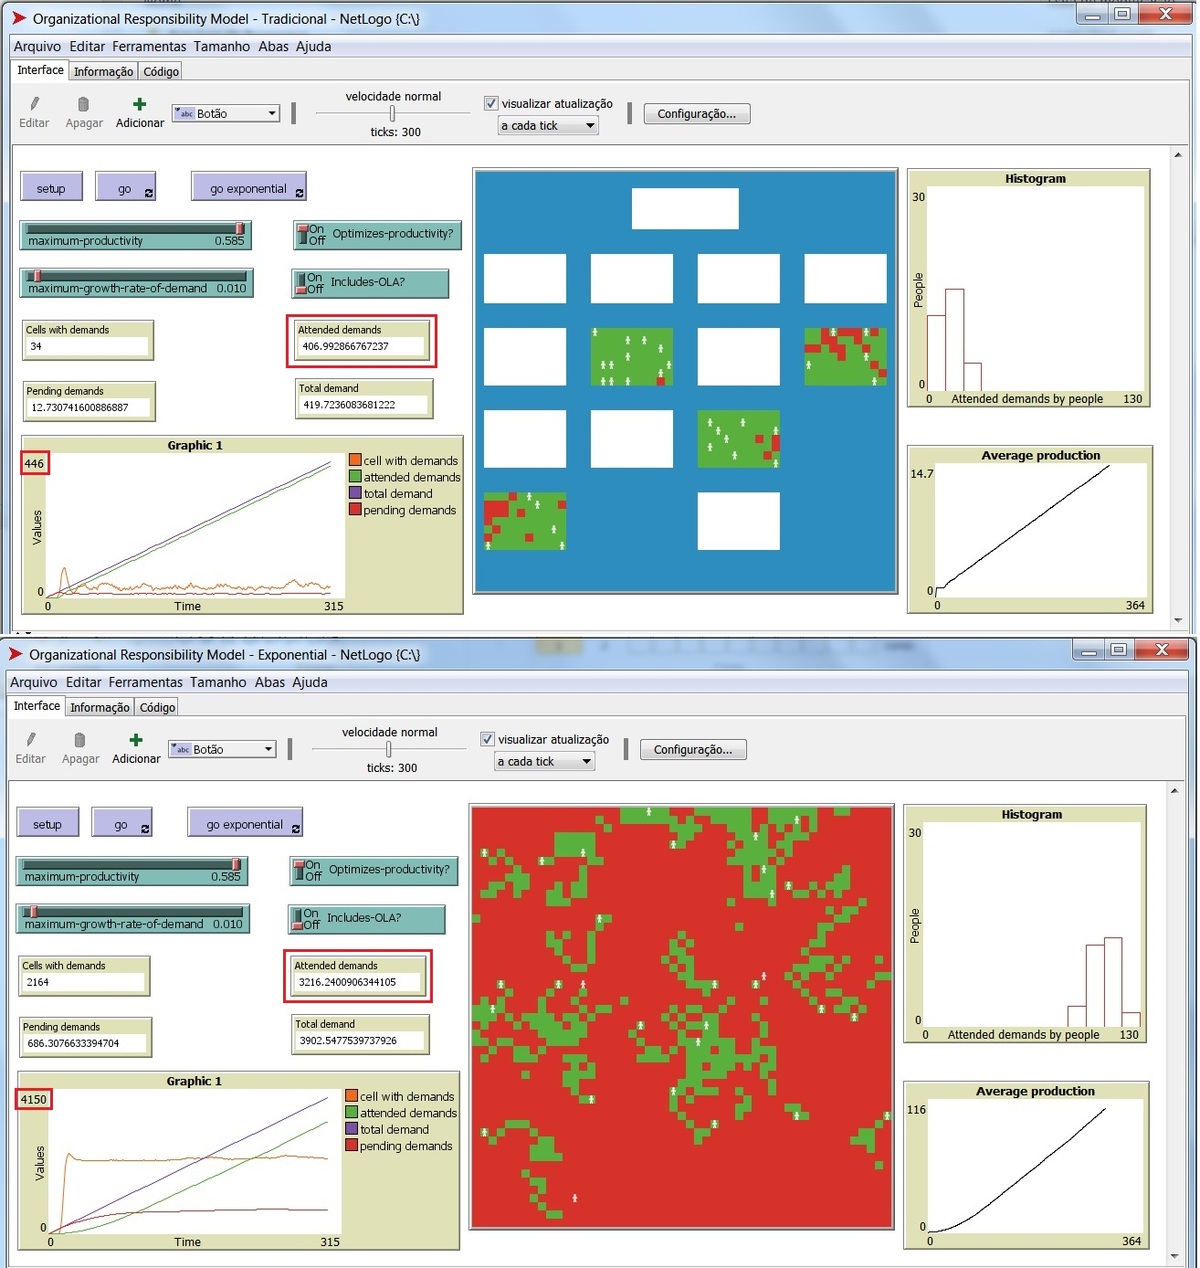
To see the differences in the companies of the future: - click "setup" then click "go" to simulate the traditional environment; - click "setup" then click "go exponential" to simulate the exponential growth environment. Now we are working in a Decision Tree that have as an input data from 1000 simulations of the Model on NetLogo. We are using Machine Learning developed in the Jupyter Notebook environment, in the Python language, to aid in the decision when to use the traditional or exponential. Over how many pending demands should the Exponential Model be used?
The answer is 370.
This section requires Javascript.
You are seeing this because something didn't load right. We suggest you, (a) try
refreshing the page, (b) enabling javascript if it is disabled on your browser and,
finally, (c)
loading the
non-javascript version of this page
. We're sorry about the hassle.
(according to Yuri Van Geest of Singularity University).
In [2]: # Load libraries in Jupyter Notebook with Python
%notebook inline
import pydotplus
import numpy as np
import pandas as pd
import matplotlib.pyplot as plt
import seaborn as sns
import graphviz
import os
os.environ["PATH"] += os.pathsep + 'C:/Users/Guto/Programas/graphviz-2.38/bin/'
from sklearn import preprocessing
from sklearn.ensemble import RandomForestClassifier
from sklearn.tree import DecisionTreeClassifier from sklearn.externals.six import StringIO from IPython.display import Image from sklearn.tree import export_graphviz
from sklearn import tree
In [5]: %notebook matplotlib
dataset.drop(u'Simulação', axis=1, inplace=True)
In [6]: dataset['Exponencial'] = pd.factorize(dataset['Exponencial'])[0]
In [7]: dataset.head()
2 Correlation of variables
In [8]: f, ax = plt.subplots(figsize=(10, 7)) corr = dataset.corr()
sns.heatmap(corr)
plt.show()
In [9]: classes = dataset.Exponencial
dataset.drop('Exponencial', axis=1, inplace=True)
In [10]: scaler = preprocessing.StandardScaler().fit(dataset)
treino = scaler.transform(dataset)
2.1 TTrain RandomForest
In [11]: clf = RandomForestClassifier(random state=0, n jobs=2)
In [12]: clf.fit(treino, classes)
In [13]: clf.feature importances
In [14]: list(zip(dataset.columns,clf.feature importances .tolist()))
In [15]: dataset.columns.tolist()
3 Plots the Importance of Features in the Model
In [16]: y = clf.feature importances .tolist()
x = np.arange(len(y))
width = 0.5
plt.barh(x, y, width, color="red")
plt.yticks(x,dataset.columns.tolist(),)
plt.xlabel('Importancia no Modelo')
plt.show()
4 Create the decision tree
In [17]: Xnovo = pd.read excel('MRO Exponencial.xlsx', header=1)
%notebook matplotlib
Xnovo.drop(u'Simulação', axis=1, inplace=True)Xnovo['Exponencial'] = pd.factorize(Xnovo['Exponencial'])[0]
ynovo = classes = Xnovo.Exponencial
clf = DecisionTreeClassifier(criterion='gini', random_state=0)
clf = clf.fit(Xnovo, ynovo)
In [19]: Xtree = pd.read excel('C:/Users/Guto/Programas/mro/MRO Exponencial.xlsx', header=1)
%notebook matplotlib
Xtree.drop(u'Simulação', axis=1, inplace=True)
In [20]: feature_names = list(Xtree.columns)
feature_names
In [21]: dot data = tree.export graphviz(clf, out_file=None,
feature names=feature names,
class_names=Xtree.Exponencial,
filled=True, rounded=True,
special_characters=True)
graph = pydotplus.graph from dot data(dot data)
Image(graph.create_png())