I Hate Venn Diagrams.
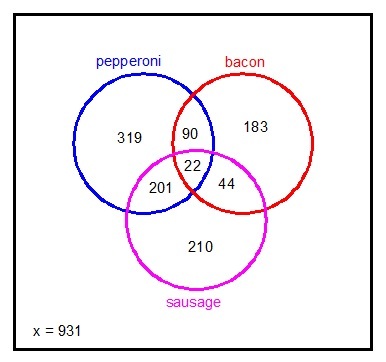
2,000 people take part in a survey to determine the preferences of the public in terms of pizza toppings. 632 say that they like pepperoni on their pizza, 339 like bacon, and 477 like sausage. 223 like both pepperoni and sausage, 112 like pepperoni and bacon, and 66 like bacon and sausage. If 22 like all 3 toppings, how many people do not like any of the toppings on their pizza?
The answer is 931.
This section requires Javascript.
You are seeing this because something didn't load right. We suggest you, (a) try
refreshing the page, (b) enabling javascript if it is disabled on your browser and,
finally, (c)
loading the
non-javascript version of this page
. We're sorry about the hassle.
5 solutions
Very good trick! I liked it. Now I do not need more to make the confused diagram.
Done the same way Finn. This type of problem is coming in my exam this month. Thanks for making me practise!!!😃😊😆 LOL.
exactly the same , it is P.I.E
Log in to reply
It is PIE, however I've simplified it a bit. Do you see why?
nice.................................
I usually use Venn diagram to solve this type of problems but have a feeling your method is quicker.
Venn diagrams are confusing and impractical (in my opinion). I like to look at numbers, not circles.
Log in to reply
i agree, venn diagram < P.I.E
Same here.
2000 - ((632 + 339 + 477) - ((223 + 112 + 66) - 22)) = 2000 - (1448 - (401 - 22)) = 2000 - (1448 - 379) = 2000 - 1069 = 931
 Let
x
be the number of people who do not like any of the toppings. Then,
x = 2 0 0 0 − ( 3 1 9 + 2 0 1 + 2 2 + 9 0 + 4 4 + 1 8 3 + 2 1 0 ) = 2 0 0 0 − 1 0 6 9 = 9 3 1
Using n( AUBUC) formula we can find the number of people who liked either of the 3 toppings so subtracting it from 2000 we get 931
2 , 0 0 0 − ( 6 3 2 + 3 3 9 + 4 7 7 − 2 2 3 − 1 1 2 − 6 6 + 2 2 ) = 9 3 1 .