Ice Storms in Florida
Suppose it's winter, and there is an ice storm in Florida, affecting the orange crop. Which of these graphs represents the most likely change in supply and demand for orange juice throughout the US?
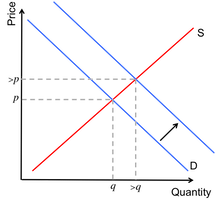
 A - Demand shifts right, prices increase
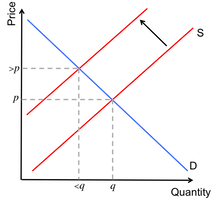
 B - Supply shifts left, prices increase
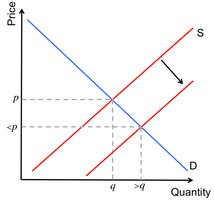
 C - Supply shifts right, prices decrease
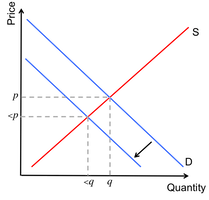
 D - Demand shifts left, prices decrease
This section requires Javascript.
You are seeing this because something didn't load right. We suggest you, (a) try
refreshing the page, (b) enabling javascript if it is disabled on your browser and,
finally, (c)
loading the
non-javascript version of this page
. We're sorry about the hassle.
A freeze of oranges is likely to decrease the quantity of oranges available. Such an even would shift the supply curve left, causing increases in price for orange juice and decreasing the quantity of orange juice purchased.