Identifying Accelerations from Graphs
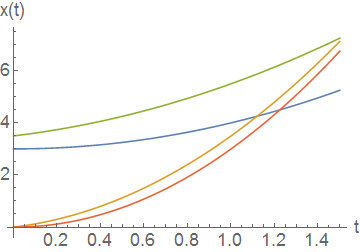
The below plot shows the positions of four particles undergoing different constant accelerations as a function of time. What is the color of the curve that represents the particle accelerating at the fastest rate?

This section requires Javascript.
You are seeing this because something didn't load right. We suggest you, (a) try
refreshing the page, (b) enabling javascript if it is disabled on your browser and,
finally, (c)
loading the
non-javascript version of this page
. We're sorry about the hassle.
The green and blue curves are distractions; although the magnitudes of the displacements of both may be larger at any given time, the displacement is clearly growing at a much slower rate than the other two curves, so their accelerations will not be as large.
To note that the red curve represents a larger acceleration than the gold curve, note that the gap between the two curves is closing over time. Although the gap grew briefly because the gold curve started with a nonzero velocity and the red did not, the fact that the red is starting to overtake the gold means that the red is accelerating more quickly; the faster acceleration will win out over time because the acceleration term is quadratic in time.