P-V Diagram
Chemistry
Level
2
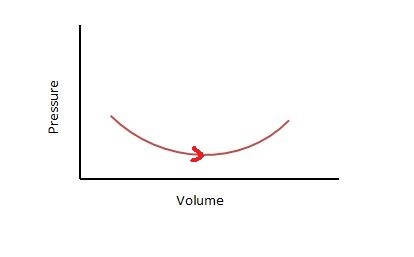
Consider the process on a system as shown for an ideal gas. During the process the work done by the system:
first decreases then increases
continuously decreases
first increases then decreases
continuously increases
This section requires Javascript.
You are seeing this because something didn't load right. We suggest you, (a) try
refreshing the page, (b) enabling javascript if it is disabled on your browser and,
finally, (c)
loading the
non-javascript version of this page
. We're sorry about the hassle.
Work is simply area under the P-V curve. Once you realize this, the answer becomes obvious.