SAT Absolute Value
 Shown above is the graph of function
. Which of the following is a graph of the function
?
Shown above is the graph of function
. Which of the following is a graph of the function
?
This section requires Javascript.
You are seeing this because something didn't load right. We suggest you, (a) try
refreshing the page, (b) enabling javascript if it is disabled on your browser and,
finally, (c)
loading the
non-javascript version of this page
. We're sorry about the hassle.
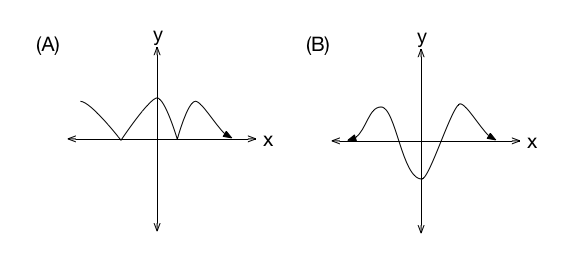
Correct Answer: B
Solution 1:
Tip: ∣ x ∣ = { − x x if x < 0 if x ≥ 0 .
We use the definition of absolute value to conclude that
for x < 0 , we have f ( ∣ x ∣ ) = f ( − x ) and
for x > 0 , we have f ( ∣ x ∣ ) = f ( x ) .
Hence, we want to keep the positive x-axis, and also flip it across the y-axis to obtain the graph of the negative x-axis.
This gives us the graph of (B).
Solution 2:
Tip: ∣ x ∣ = { − x x if x < 0 if x ≥ 0 .
Tip: When transforming graphs, trace what happens to each point.
f ( ∣ 4 ∣ ) = f ( 4 )
f ( ∣ 3 ∣ ) = f ( 3 )
f ( ∣ 2 ∣ ) = f ( 2 )
f ( ∣ 1 ∣ ) = f ( 1 )
f ( ∣ 0 ∣ ) = f ( 0 )
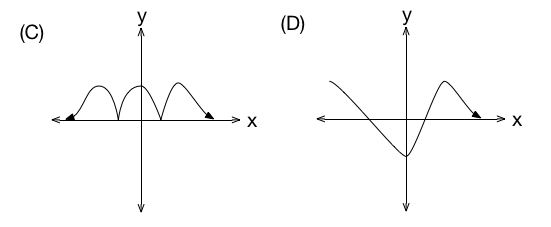
These 5 points are represented in red below. They are retained from the original graph, which is in black.
f ( ∣ − 1 ∣ ) = f ( 1 )
f ( ∣ − 2 ∣ ) = f ( 2 )
f ( ∣ − 3 ∣ ) = f ( 3 )
f ( ∣ − 4 ∣ ) = f ( 4 )
These 4 points are represented in blue above. We connect the red and the blue points to form the shape of the new graph, which is in a dotted line. This is the graph of (B).
Incorrect Choices:
(A)
This is the graph of y = ∣ f ( x ) ∣ .
(C)
This is the graph of y = ∣ f ( ∣ x ∣ ) ∣ .
(D)
This is the graph of y = f ( x ) .
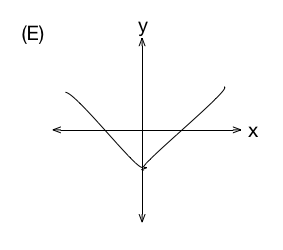
(E)
This is the graph of y = f ( − ∣ x ∣ ) .