SAT Sets and Venn Diagrams
If and which of the following Venn diagrams represents the relationship between the two sets?


This section requires Javascript.
You are seeing this because something didn't load right. We suggest you, (a) try
refreshing the page, (b) enabling javascript if it is disabled on your browser and,
finally, (c)
loading the
non-javascript version of this page
. We're sorry about the hassle.
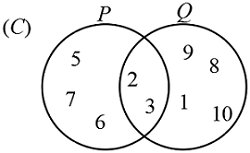
Correct Answer: C
Solution:
The two elements that sets P and Q have in common are 2 and 3. So we can eliminate choices (A), (B), and (E). Notice that in choice (D) 2 and 3 appear inside the area the two circles share, but also in the area that P doesn't share with Q , and in the area that Q doesn't share with P . This choice is wrong. We are left with choice (C), which is the correct answer.
Incorrect Choices:
(A) , (B) , (D) , and (E)
The solution shows how to eliminate these choices.