Spooky Spooky Spooky
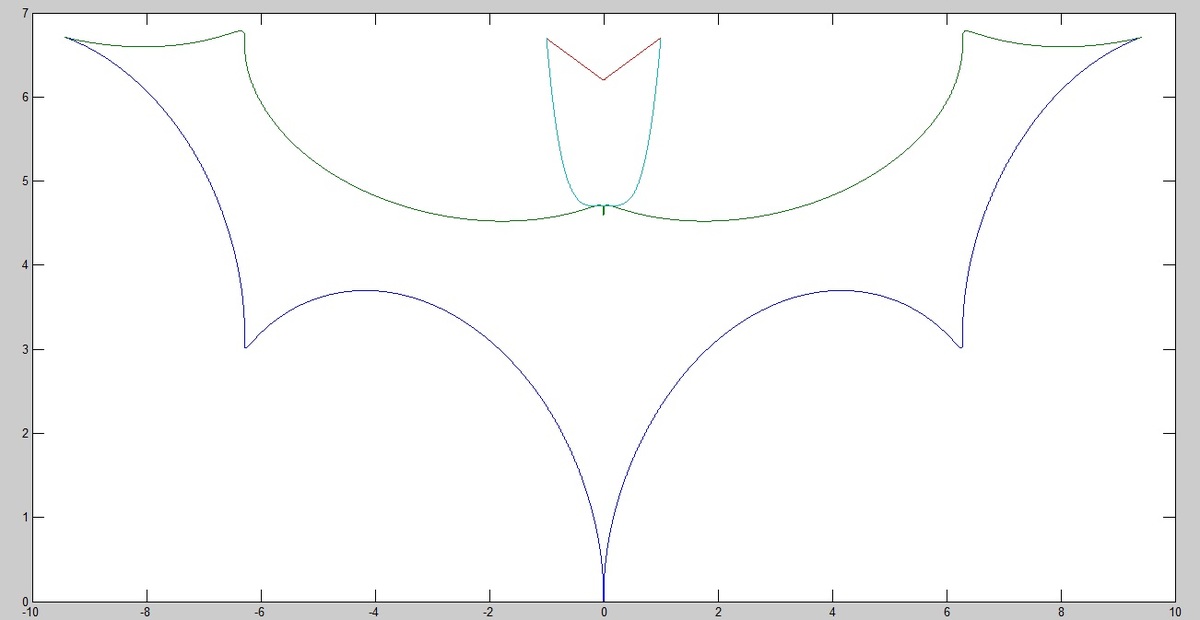
x = t − sin ( t ) , y = 1 − cos ( t ) + 0 . 5 ∣ t ∣ , − 3 π < t < 3 π
x = t − sin ( t ) , y = 4 . 1 + 0 . 5 cos ( t ) + 0 . 3 3 ∣ t ∣ , − 3 π < t < 3 π
y = 0 . 5 ∣ x ∣ + 6 . 2 , − 1 < x < 1
y = 2 x 4 + 4 . 7 , − 1 < x < 1
What creepy shape do the graphs of the equations above trace out? You might want to use a graphing tool for this one!
This section requires Javascript.
You are seeing this because something didn't load right. We suggest you, (a) try
refreshing the page, (b) enabling javascript if it is disabled on your browser and,
finally, (c)
loading the
non-javascript version of this page
. We're sorry about the hassle.
3 solutions
Plot this:
( ( 7 x ) 2 ∣ x ∣ − 3 ∣ ∣ x ∣ − 3 ∣ + ( 3 x ) 2 y + 7 3 3 3 ∣ y + 7 3 3 3 ∣ − 1 ) ⋅ ( ∣ 2 x ∣ − ( 1 1 2 3 3 3 − 7 ) x 2 − 3 + 1 − ( ∣ ∣ x ∣ − 2 ∣ − 1 ) 2 − y ) ⋅ ( 9 ( 1 − ∣ x ∣ ) ( ∣ x ∣ − . 7 5 ) ∣ ( ∣ x ∣ − 1 ) ( ∣ x ∣ − . 7 5 ) ∣ − 8 ∣ x ∣ − y ) ⋅ ( 3 ∣ x ∣ + . 7 5 ( . 7 5 − ∣ x ∣ ) ( ∣ x ∣ − . 5 ) ∣ ( ∣ x ∣ − . 7 5 ) ( ∣ x ∣ − . 5 ) ∣ − y ) ⋅ ( 2 . 2 5 ( . 5 − ∣ x ∣ ) ( . 5 + ∣ x ∣ ) ∣ ( ∣ x ∣ − . 5 ) ( ∣ x ∣ + . 5 ) ∣ ) ⋅ ( 7 6 1 0 + ( 1 . 5 − . 5 ∣ x ∣ ) ∣ x ∣ − 1 ∣ ∣ x ∣ − 1 ∣ − 1 4 6 1 0 4 − ( ∣ x ∣ − 1 ) 2 − y ) = 0
matlab code : t=-3
pi:0.001:3
pi;
x1=t-sin(t);
y1=1-cos(t)+0.5
abs(t);
x2=x1;
y2=4.1+0.5
cos(t)+0.33
abs(t);
x=-1:0.001:1;
y3=0.5
abs(x)+6.2;
y4=(2*x.^4)+4.7;
plot(x1,y1,x2,y2,x,y3,x,y4)
You need to put a lvl cause it gives only 10 points xD it took me some minutes to solve it.
Yeah but you could easily graph it, no sense in free points...
Here's what a plot of this guy looks like:
If that's not a scary looking bat , then I don't know what is.