Sunny Shoot-out

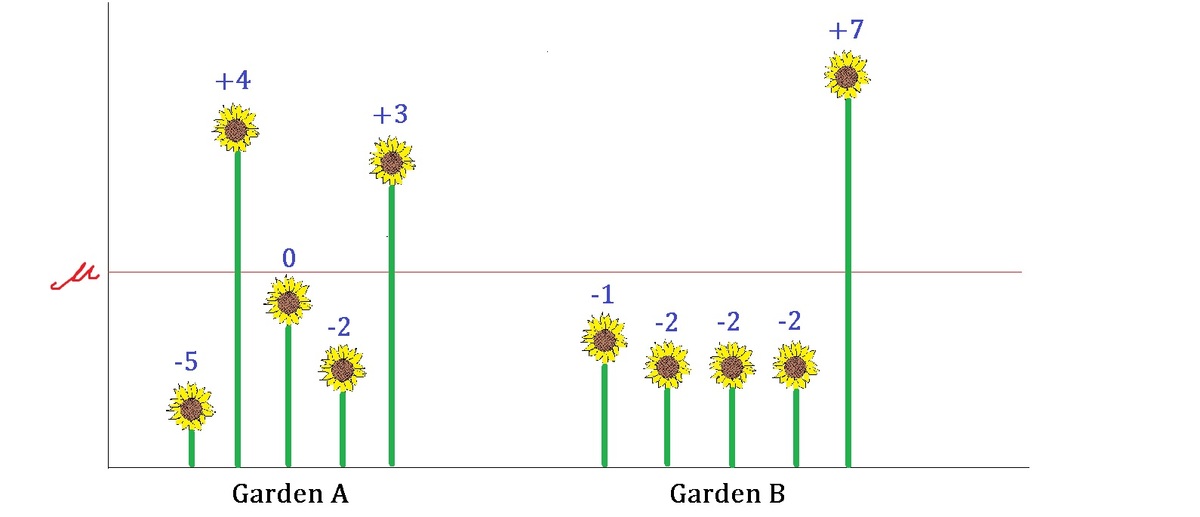
You are planting 5 sunflowers in each of the 2 gardens, where these sets of plants shoot out in varying heights.
Shown above is the graph depicting the height of each sunflower, where the red line indicates the mean height of sunflower population .
For example, the shortest sunflower in Garden A is 5 cm shorter than average while the highest one in Garden B is 7 cm higher than average.
Which set of sunflowers has higher population variance?
This section requires Javascript.
You are seeing this because something didn't load right. We suggest you, (a) try
refreshing the page, (b) enabling javascript if it is disabled on your browser and,
finally, (c)
loading the
non-javascript version of this page
. We're sorry about the hassle.
Relevant wiki: Variance - Properties
In order to determine the variance of each set, we need to know the mean of each set first.
Thus, for garden A, the mean μ A = 5 ( μ − 5 ) + ( μ − 2 ) + ( μ − 0 ) + ( μ + 3 ) + ( μ + 4 ) = μ .
Therefore, the mean in garden A equals the mean of sunflower population.
Similarly, for garden B, the mean μ A = 5 ( μ − 1 ) + ( μ − 2 ) + ( μ − 2 ) + ( μ − 2 ) + ( μ + 7 ) = μ .
Thus, both gardens have got the same mean and number of flowers.
And since variance = n ∑ ( x − μ ) 2 (see variance theorem ), we can subtract all height data with μ in order to find the variance.
Therefore, variance in garden A = 5 ( − 5 ) 2 + ( − 2 ) 2 + 0 2 + 3 2 + 4 2 = 5 5 4 .
Then variance in garden B = 5 ( − 1 ) 2 + ( − 2 ) 2 + ( − 2 ) 2 + ( − 2 ) 2 + 7 2 = 5 6 2 .
As a result, the variance in garden B is higher than garden A.