Tessellate S.T.E.M.S. (2019) - Physics - School - Set 1 - Objective Problem 1
Level
1
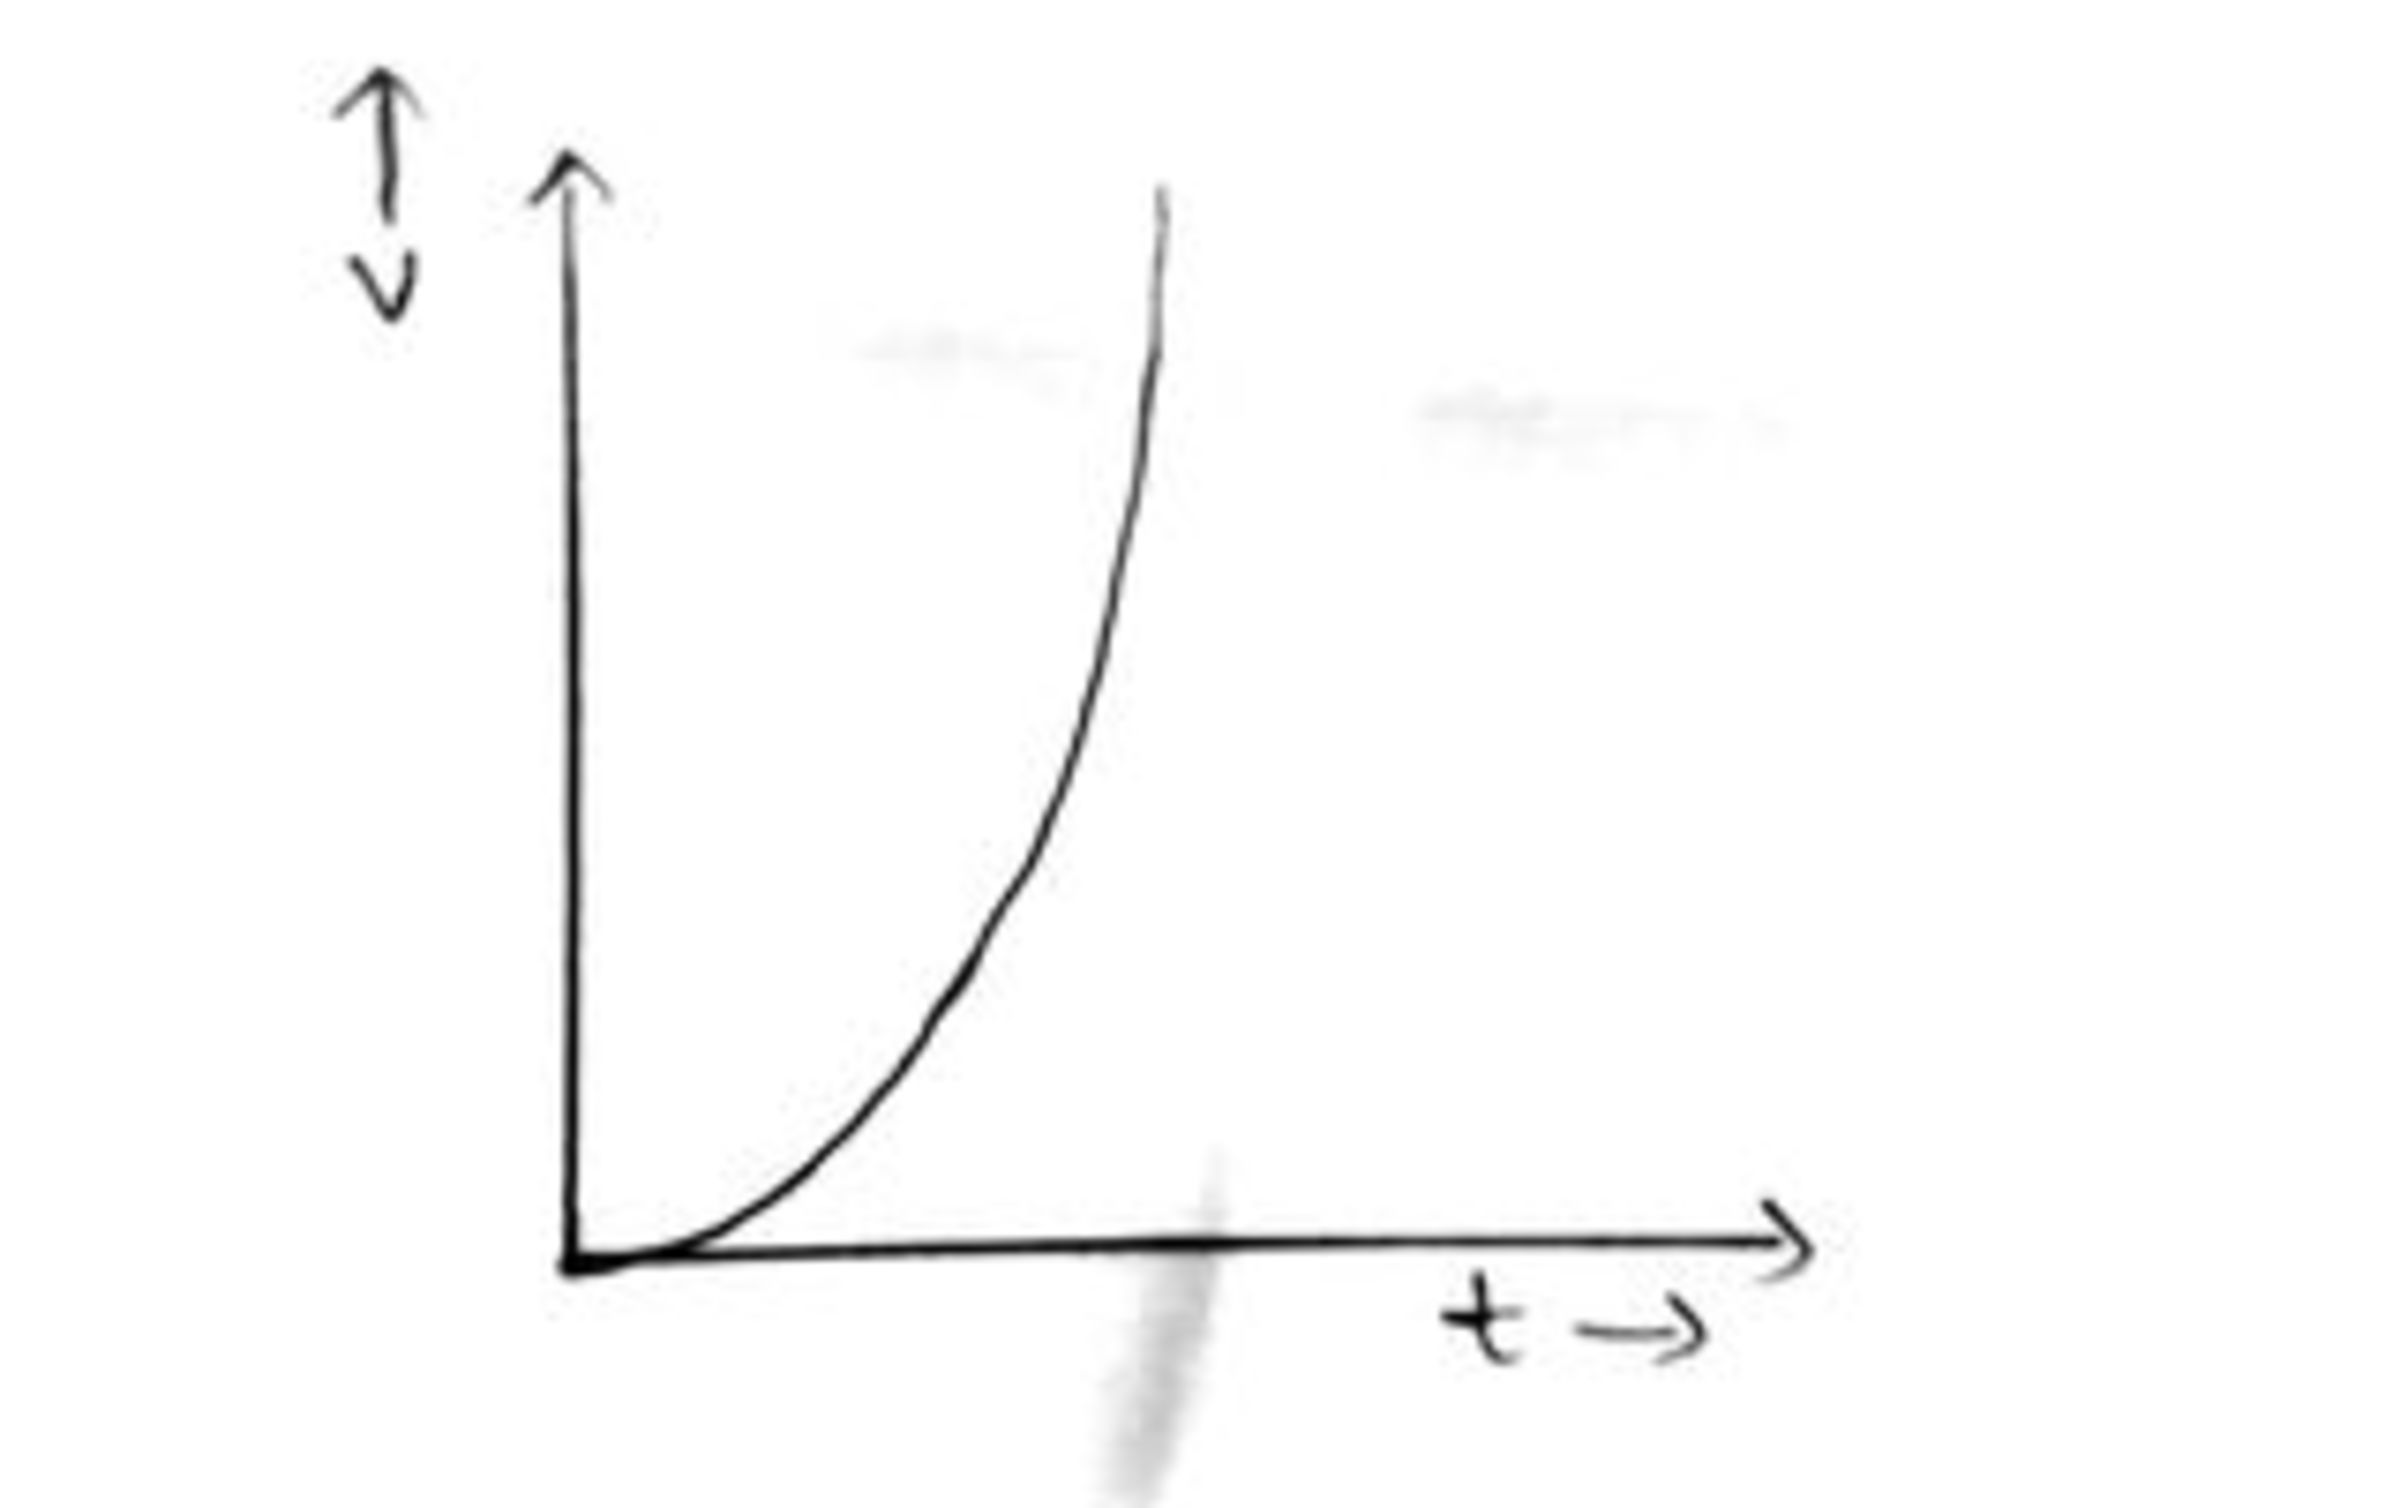
A body is at x=0 at time t=0. The velocity time graph is given below.

Acceleration increases with time
Displacement of body from origin increases whereas acceleration decreases
None of these
Displacement first increases and then decreases
This section requires Javascript.
You are seeing this because something didn't load right. We suggest you, (a) try
refreshing the page, (b) enabling javascript if it is disabled on your browser and,
finally, (c)
loading the
non-javascript version of this page
. We're sorry about the hassle.
actually the graph has v increasing with increasing time and at one point the accelaration is so high that even after the smallest interval of time the velocity is increasing drastically