The King needs your help (the end!)
An ambitious king plans to build a number of new cities in the wilderness, connected by a network of roads, so that any city can be reached from any other. He expects the annual tax revenues from each city to be numerically equal to the square of the population. Road maintenance will be expensive, though; the annual cost for each road is expected to be numerically equal to the product of the populations of the two cities that road connects. The project is considered viable as long as the tax revenues exceed the cost, regardless of the populations of the various cities (as long as at least one city has any inhabitants at all). The court engineer submits some proposals (attached), but the king deems them "boring" and asks for other options. How many other graphs are there (up to isomorphism) that make this project viable?
The answer is 3.
This section requires Javascript.
You are seeing this because something didn't load right. We suggest you, (a) try
refreshing the page, (b) enabling javascript if it is disabled on your browser and,
finally, (c)
loading the
non-javascript version of this page
. We're sorry about the hassle.
For the graph to be viable, it must not contain the following sub-graphs (most of this was discussed in earlier iterations of this problem):
Loops (place 1 person in each city on the loop for a break-even situation)...thus the graph must be a tree,
Cities with 4 or more neighbors (place 2 people in the central city and 1 person in 4 of its neighbors for a break -even situation).
More than 1 city with 3 neighbors. Indeed, if we had 2 cities A and B with 3 neighbors each, we could place 2 people in each of these cities as well as all the cities along the road connecting them. Also, we place 1 person in each of the 4 neighbors of A and B besides the 2 that have already been populated, again, making for a break-even situation.
Thus we may assume, without loss of generality, that we have 1 central city, C, and 3 roads of various lengths emanating from C. Let's say that these three roads involve m, n, and p cities, respectively, not counting the central city, C. We may assume that n ≤ m ≤ p .
If we complete the squares of our quadratic form, starting at the ends of the three roads and working our way towards the center, the coefficient of the central city ends up being c = 1 − 2 n + 2 n − 2 m + 2 m − 2 p + 2 p (we leave this as an exercise to the reader; obviously, it suffices to do the computation for one of the roads). The graph will be viable if (and only if) this coefficient c is positive.
If n ≥ 2 , then c ≤ 0 , so that the plan isn't viable... thus we must have n = 1 .
We already know the solutions n = m = 1 , with arbitrary p... that's one of the "boring" solutions.
If m ≥ 3 , then c ≤ 0 , so that the plan isn't viable... thus we must have m = 2 to get a "new solution"
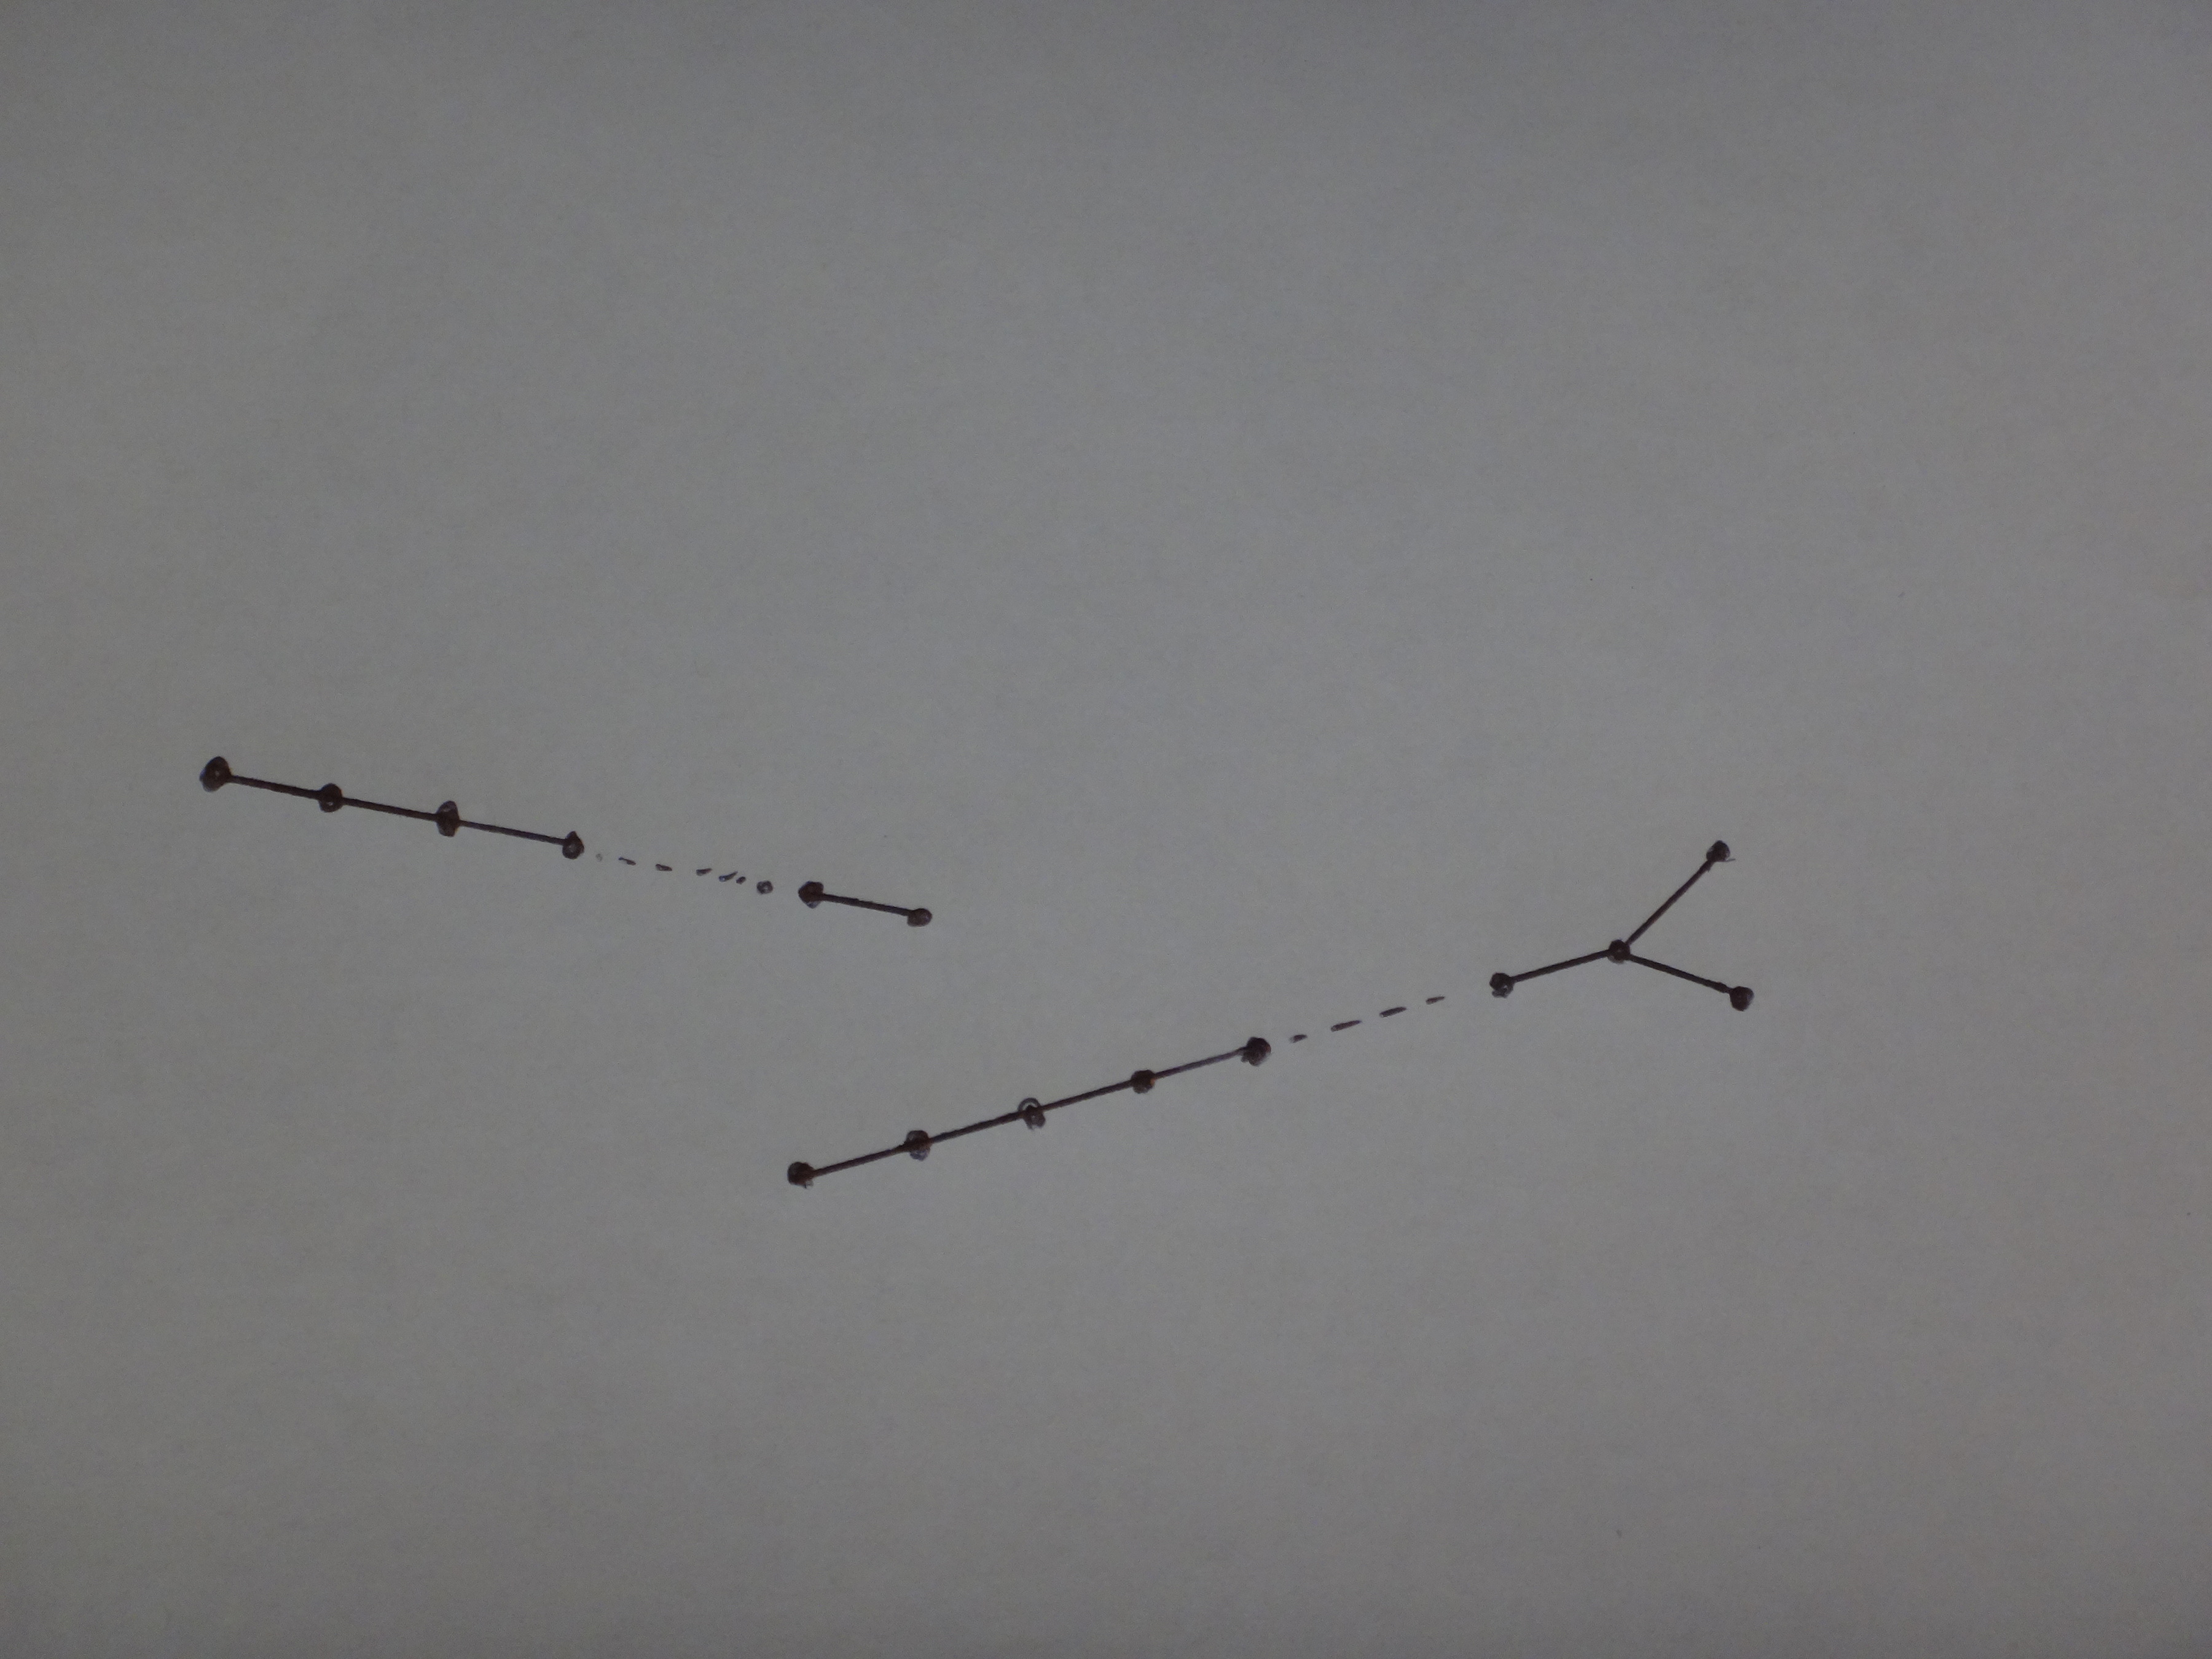
Now c = 1 − 4 1 − 3 1 − 2 p + 2 p = 1 2 5 − 2 p + 2 p , which is positive for p = 2 , 3 , 4 . There are 3 graphs that work, besides the "boring" ones.
With this playful example, we have taken a look at an important and well-understood branch of algebra... the graphs we found are the Dynkin Diagrams , and the quadratic form we studied is the Tits Form.