Volatility drag - ii
 As we've seen, volatility is hazardous to your wealth. A perfectly fine investment, humming along with some constant average daily return, will return significantly less than what you might project assuming a noise free trajectory. Fluctuations shed the value of your investment in a non-recoverable way, much like kinetic energy is shed from airplanes by wind resistance, or how heat is lost from windows with poor insulation.
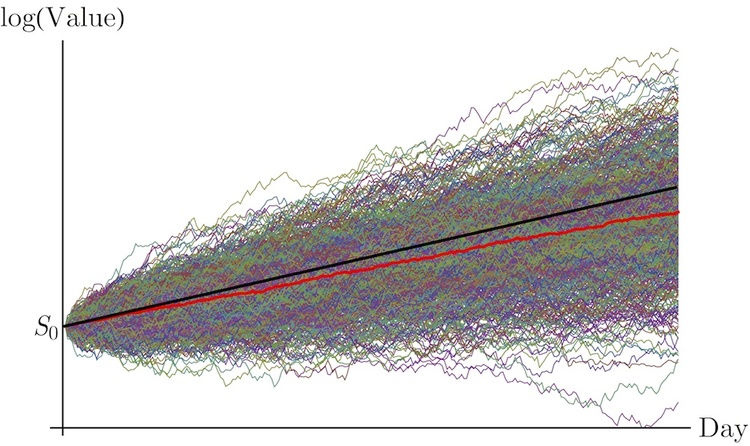
This file contains 600 rows, each of which contains the daily returns of a fictional stock over the 252 trading days of 2013. Each trajectory was generated by randomly drawing a rate, , from a normal distribution, centered about , with standard deviation , for each day, , in the year.
Clearly, there are a range of outcomes all of which are consistent with the statistical properties of the investment. However, if we take the median value of the value on day , we can get a good idea of the typical performance of the stock.
The median overall return on the year is given by . By comparison, we'd expect a noise-free investment of the same average return to yield an overall value .
How much value are we losing to fluctuations? Download the file , analyze the data, and find the value of
Details
- Note, indicates the median value of .
The answer is 7.80813.
This section requires Javascript.
You are seeing this because something didn't load right. We suggest you, (a) try
refreshing the page, (b) enabling javascript if it is disabled on your browser and,
finally, (c)
loading the
non-javascript version of this page
. We're sorry about the hassle.
0 solutions
No explanations have been posted yet. Check back later!