What does this graph look like?
y = min ( ∣ x ∣ , 1 + ∣ ∣ x ∣ + x ∣ , 2 + ∣ ∣ x ∣ − x ∣ )
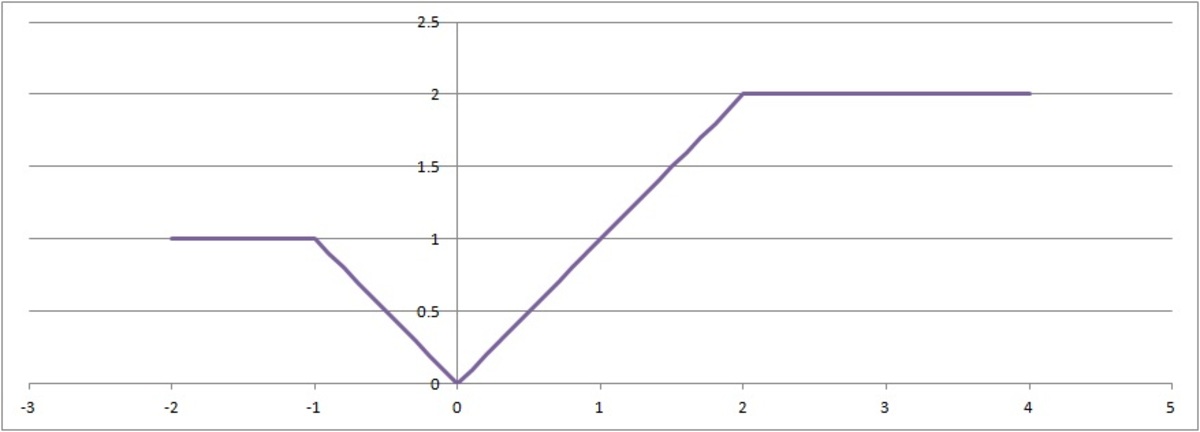
On the interval [ − 2 , 4 ] , what does the graph of y look like?
This section requires Javascript.
You are seeing this because something didn't load right. We suggest you, (a) try
refreshing the page, (b) enabling javascript if it is disabled on your browser and,
finally, (c)
loading the
non-javascript version of this page
. We're sorry about the hassle.
2 solutions
Haha. Yea, that's how I came up with the problem.
I wanted to convert it into a single function, but then that became too complicated.
Log in to reply
I like the Heaviside step function for this reason.
y = 1 + ( ∣ x ∣ − 1 ) u ( x + 1 ) + ( 2 − ∣ x ∣ ) u ( x − 2 )
Okay, well maybe it's not any less complicated...
y = min ( ∣ x ∣ , 1 + ∣ ∣ x ∣ + x ∣ , 2 + ∣ ∣ x ∣ − x ∣ ) = ⎩ ⎪ ⎪ ⎪ ⎪ ⎨ ⎪ ⎪ ⎪ ⎪ ⎧ x < 0 x ≥ 0 ⇒ min ( ∣ x ∣ , 1 , 2 + 2 ∣ x ∣ ) ⇒ min ( ∣ x ∣ , 1 + 2 ∣ x ∣ , 2 ) = { − 2 ≤ x < − 1 − 1 ≤ x < 0 ⇒ 1 ⇒ ∣ x ∣ = { 0 ≤ x < 2 2 ≤ x ≤ 4 ⇒ ∣ x ∣ ⇒ 2
The final graph is as follows -- a square-root symbol .
One way to graph this function is to graph all 3 equations. It is useful to note that ∣ ∣ x ∣ + x ∣ = 2 x for x ≥ 0 and 0 for x < 0 , while ∣ ∣ x ∣ − x ∣ = 0 for x ≥ 0 and 2 x for x < 0 .
Then, we can "trace" over the minimum of the three graphs: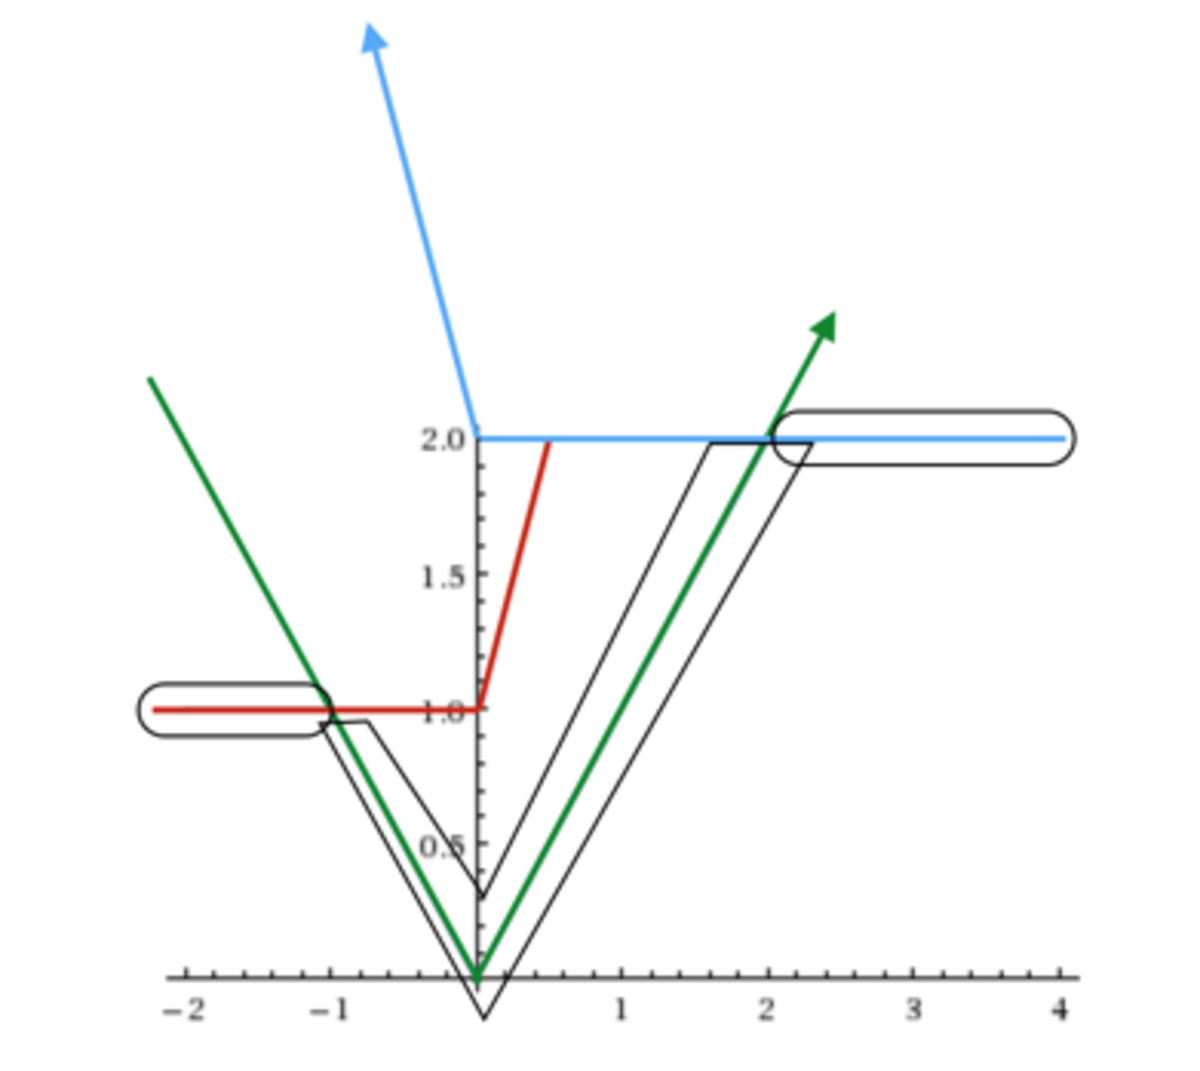
Alas, we have a square root symbol!