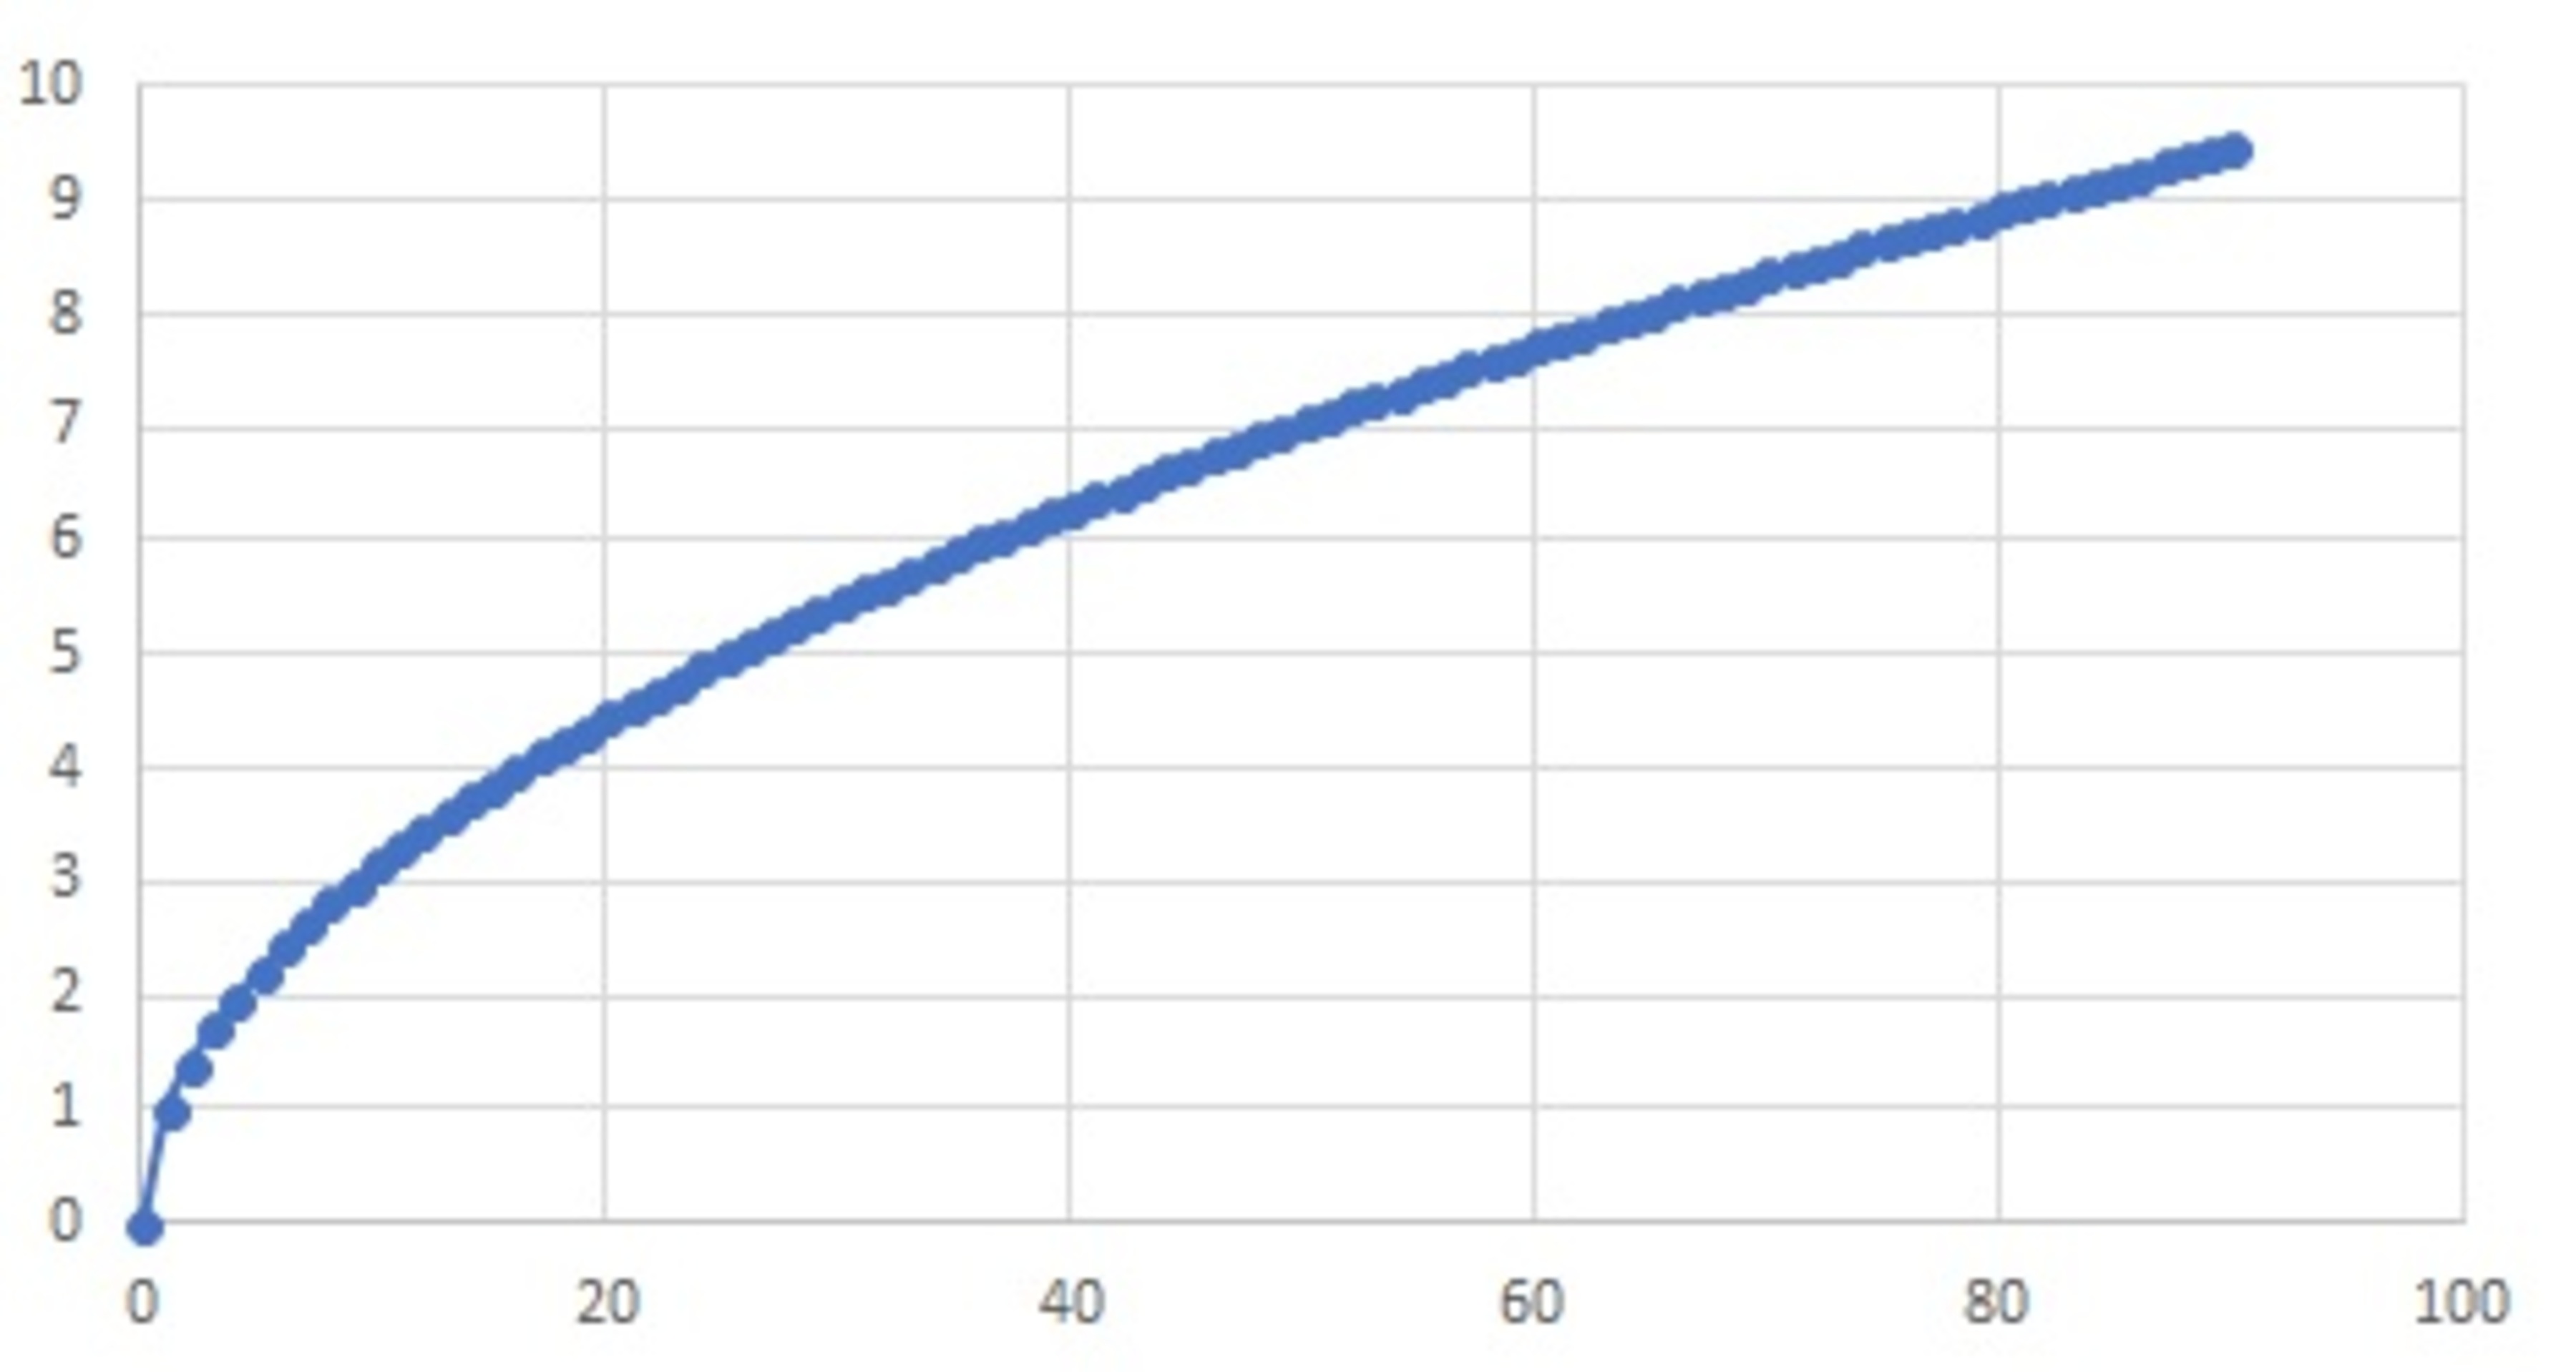
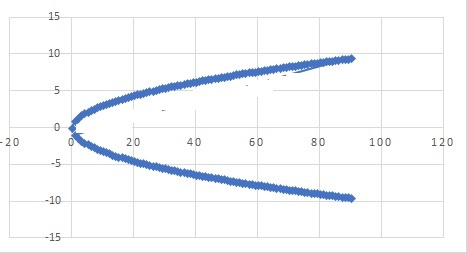
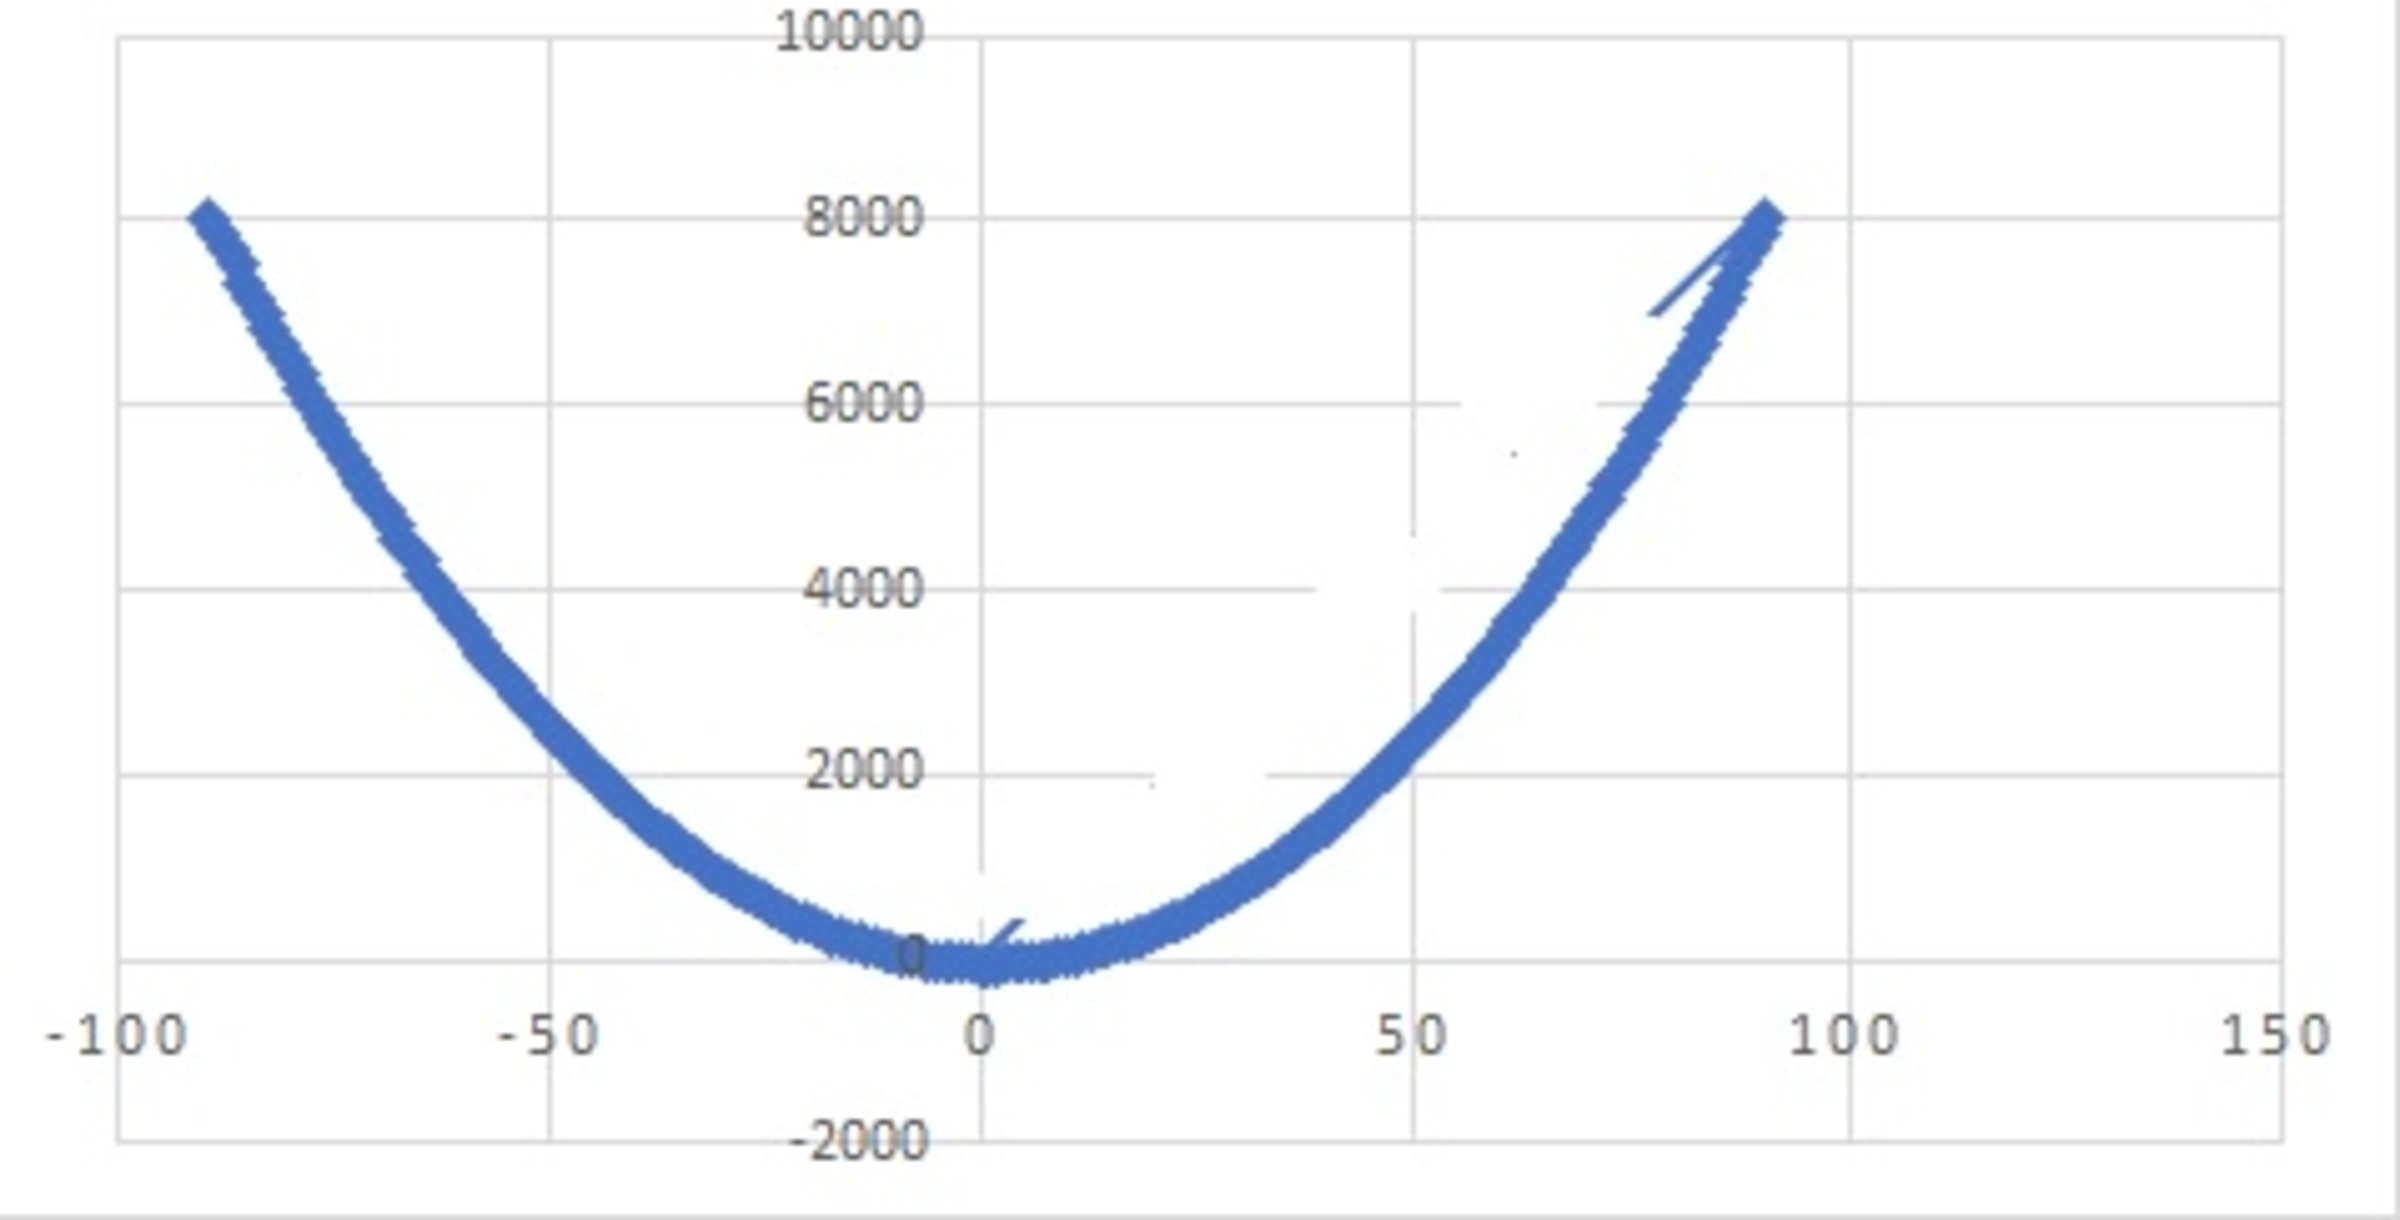
Which graph depicts this function
If then which of the graphs below depicts .
Option A

Option B

Option C

This section requires Javascript.
You are seeing this because something didn't load right. We suggest you, (a) try
refreshing the page, (b) enabling javascript if it is disabled on your browser and,
finally, (c)
loading the
non-javascript version of this page
. We're sorry about the hassle.
F(X) = sqrt(X) has + both positive and negative values of F(x) for all X >= 0. For example sqrt(4) has two values + 2 and -2. Option A is plotted for only positive values of sqrt(x). Option C is plotted for negative values of x for which f(x) is not defined. So Option B is the correct choice.