Analysis page (Most common Number of prime factors)
All the analysis made from the outputs of participants will be shown here.
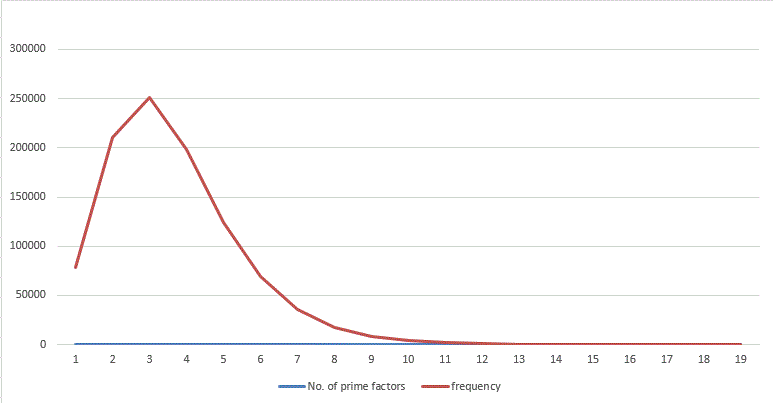
Graph of Prime factor distribution from to :
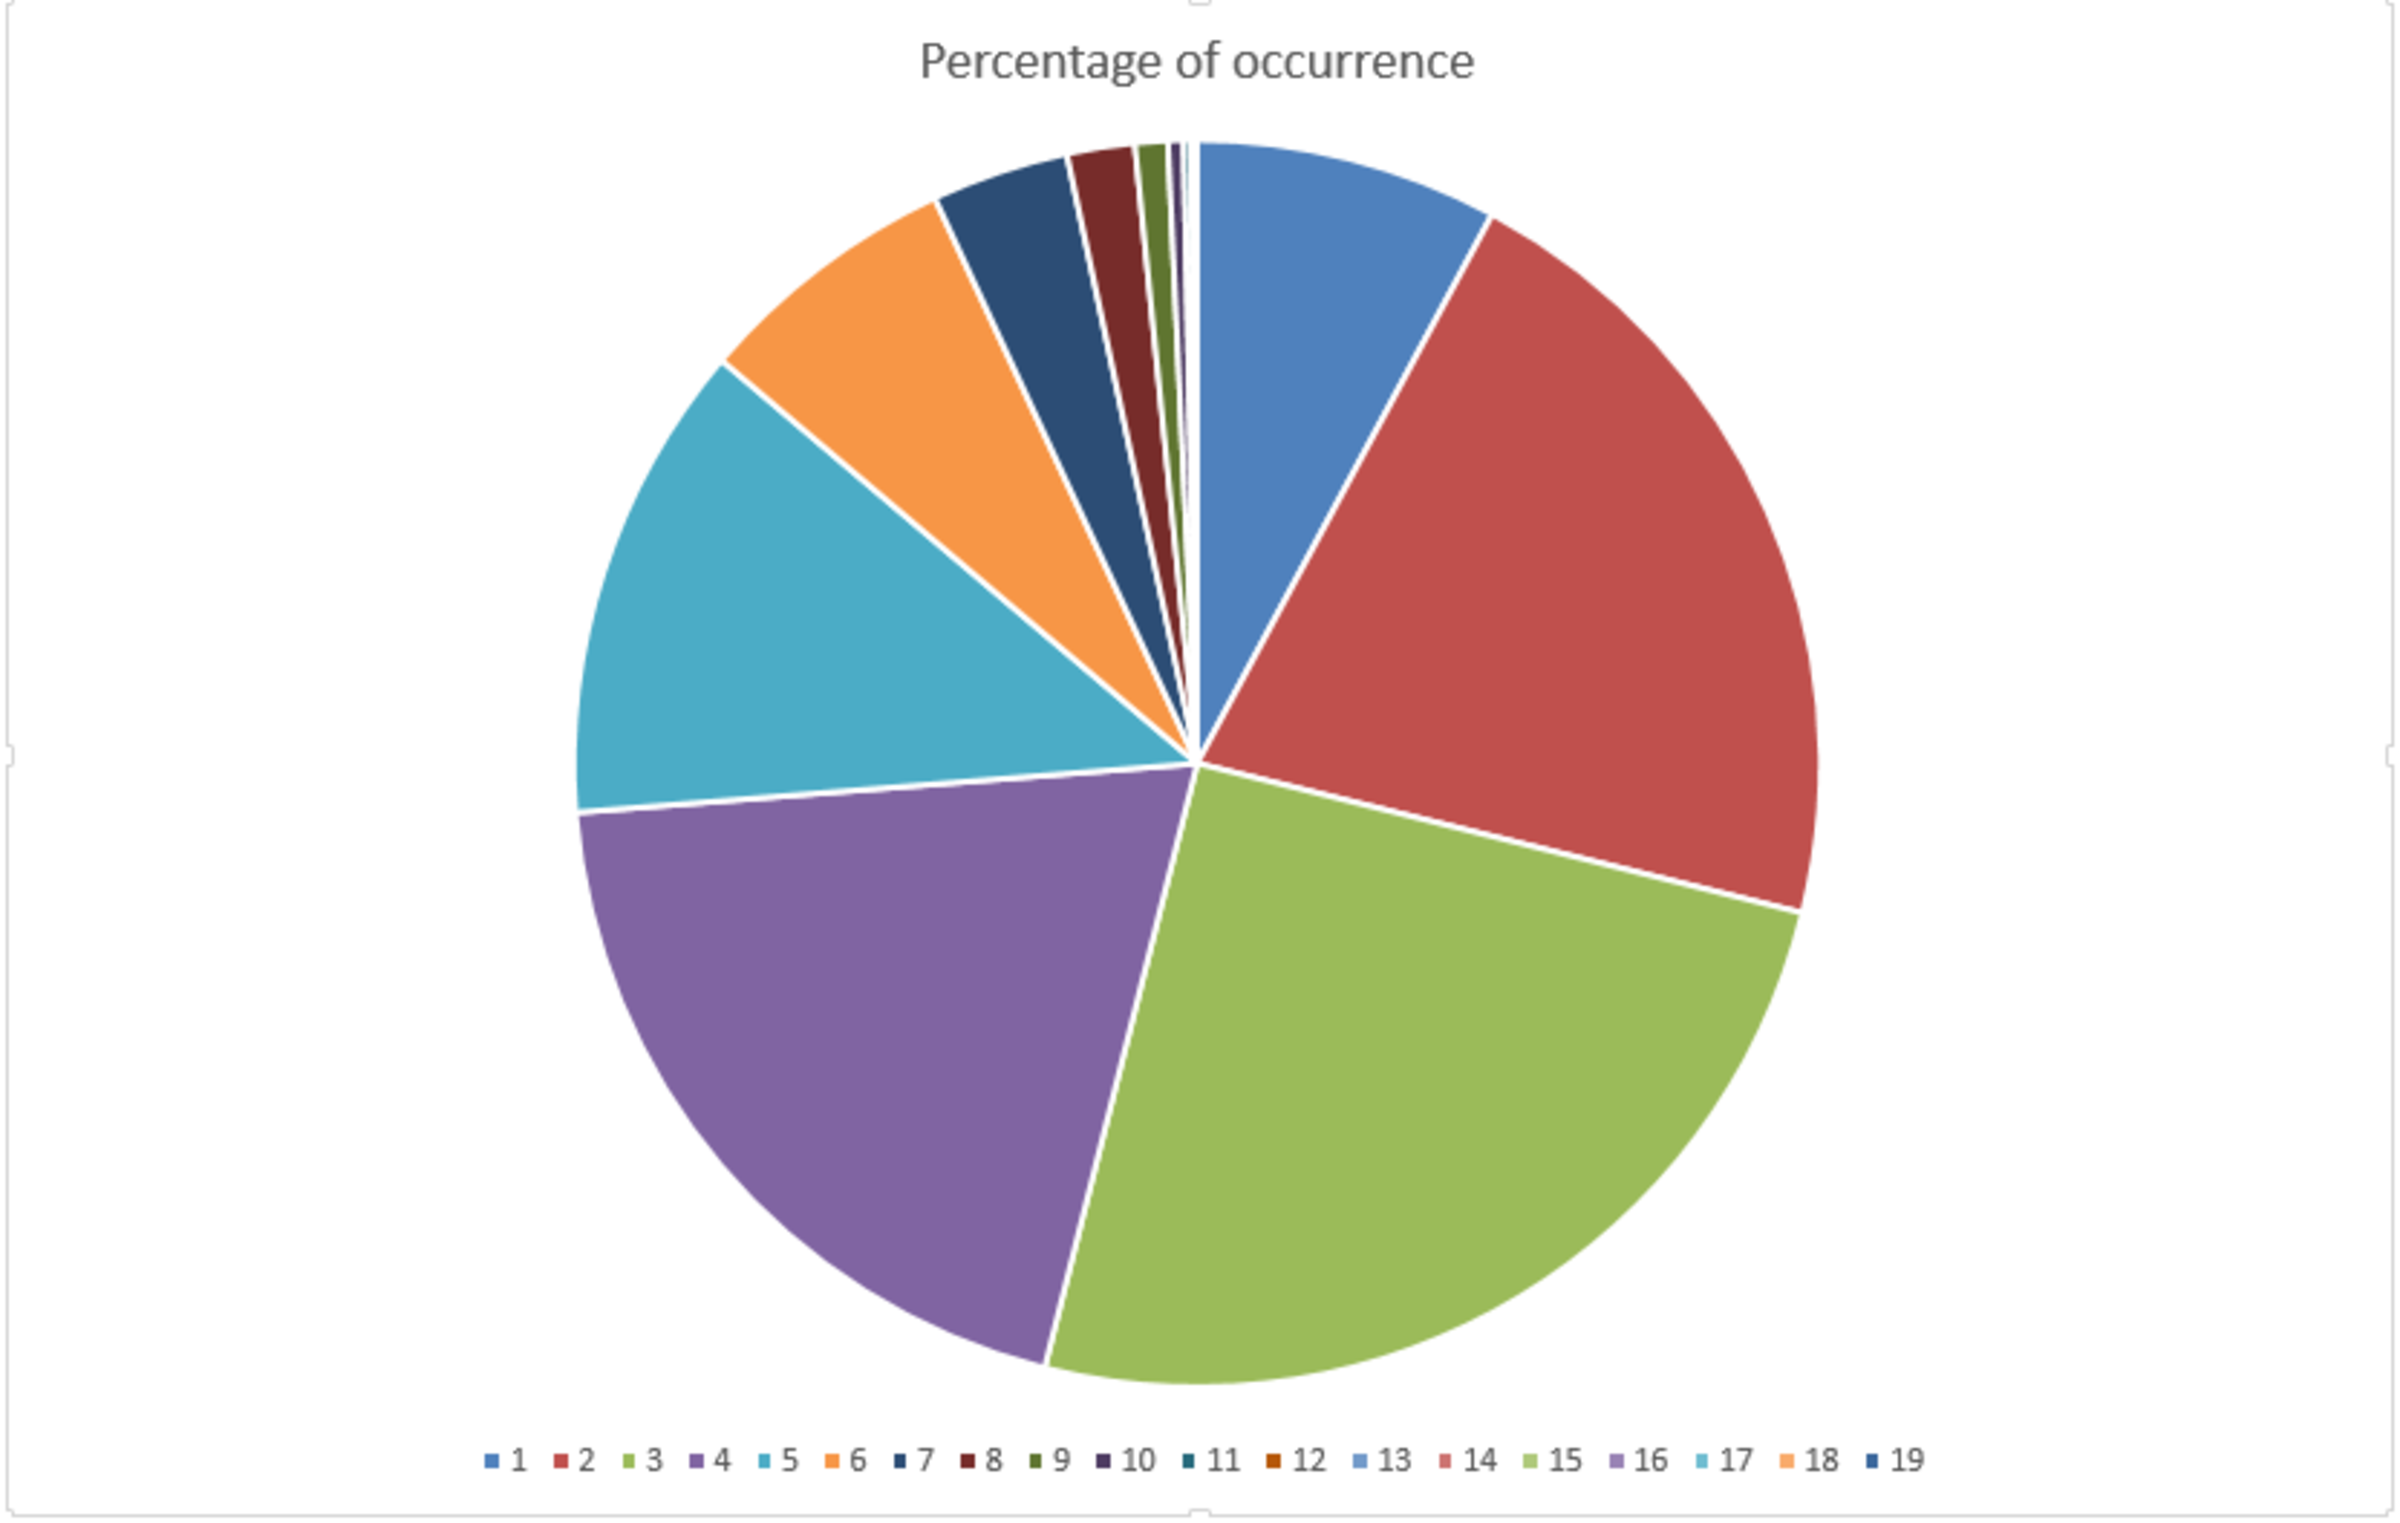
Graph of Number of prime factors occurrence percentage (till ):
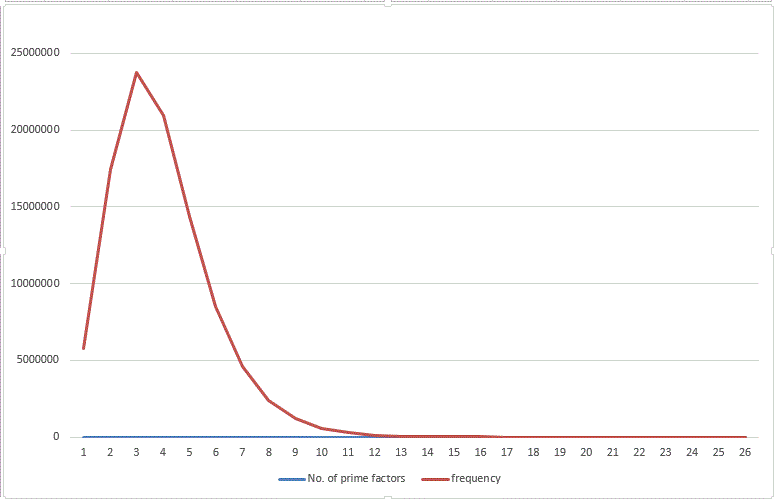
Graph of Prime factor distribution from to :
Note :
If you have another idea (rather than line graph) of representing the data then please share!
Thanks to Páll Márton to submit answer till .
Note by
Zakir Husain
10 months, 3 weeks ago
Easy Math Editor
This discussion board is a place to discuss our Daily Challenges and the math and science related to those challenges. Explanations are more than just a solution — they should explain the steps and thinking strategies that you used to obtain the solution. Comments should further the discussion of math and science.
When posting on Brilliant:
*italics*or_italics_**bold**or__bold__paragraph 1
paragraph 2
[example link](https://brilliant.org)> This is a quote# I indented these lines # 4 spaces, and now they show # up as a code block. print "hello world"\(...\)or\[...\]to ensure proper formatting.2 \times 32^{34}a_{i-1}\frac{2}{3}\sqrt{2}\sum_{i=1}^3\sin \theta\boxed{123}Comments
@Zakir Husain I think Pie chart will be better as it will help visualise more clearly.
Log in to reply
Sure!
It seems that till 106 numbers with number of prime factors - 2,3,4 are most common. Also highly composite number are more rare than primes
Reminds me of (x−k)n1...
Log in to reply
What? I didn't understood, what you meant?
Log in to reply
x=number of prime factors, k & n are unknown constants, the output of the function is the number of number that have x prime factors.
Matches the graph
Log in to reply
Are you asking or telling???
Except for x<2 I guess?
Looking great @Zakir Husain ! Could you share the actual numbers as well?
Announcement: New plan is here, everything is nearly changed now