Graph of an absolute value
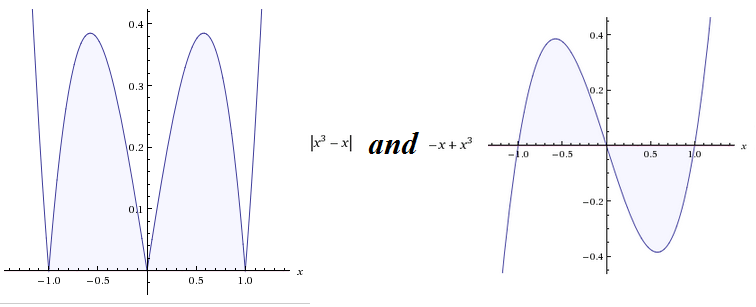
When graphing, some people normally do point plotting. Some people use the properties of curves(extent, symmetry, intercepts, asymptotes(vertical, horizontal and slant)). I've wondered why is it that I'm taught that a graph of an absolute value of a linear equation is always a 'V' shape, what's the reason behind it. Out of curiosity, I've search the graph of the absolute value of a cubic equation and it didn't made any sense and when i removed the absolute value it still didn't made much sense. I tried to graph an absolute value of a quadratic equation but it still doesn't make any sense so when I removed the absolute value I know for sure the graph would be always a parabola. When I compared the two graphs together, I saw that the graphs are similar but in the absolute value the graph is inverted (this meant for me an 'absolute value' where something look positive) at y-axis making y as positive. You could simply use the properties of a curve and then invert y(making all y values positive) to make its graph. All absolute value of linear equation a 'V' shape because the graph of a linear equation is always a line. For the technical definition of an absolute value please refer to http://www.purplemath.com/modules/exponent5.htm#definition. Source of photo: wolfram alpha.
Note by
Elaine Grace
7 years, 5 months ago
Easy Math Editor
This discussion board is a place to discuss our Daily Challenges and the math and science related to those challenges. Explanations are more than just a solution — they should explain the steps and thinking strategies that you used to obtain the solution. Comments should further the discussion of math and science.
When posting on Brilliant:
*italics*or_italics_**bold**or__bold__paragraph 1
paragraph 2
[example link](https://brilliant.org)> This is a quote# I indented these lines # 4 spaces, and now they show # up as a code block. print "hello world"\(...\)or\[...\]to ensure proper formatting.2 \times 32^{34}a_{i-1}\frac{2}{3}\sqrt{2}\sum_{i=1}^3\sin \theta\boxed{123}Comments
how to find the absolute value of sinx+2x^2