I made a project on Graph Theory. Feedback needed.
Hi. I have been working on an open-source project called D3 Graph Theory. It is aimed at anyone who wants to learn graph theory in an interactive manner. The project makes extensive use of visuals to explain concepts.
This project is still under development. And I think the Brilliant community can provide me with genuine ideas and feedback on this project. Kindly check it out and give suggestions. Thank you.
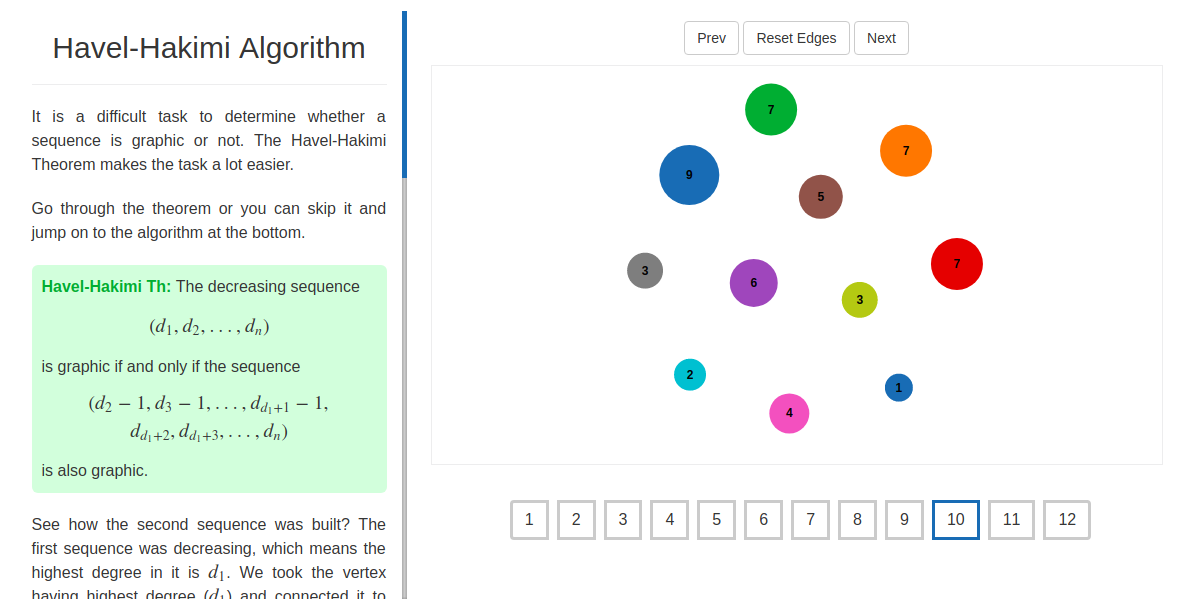
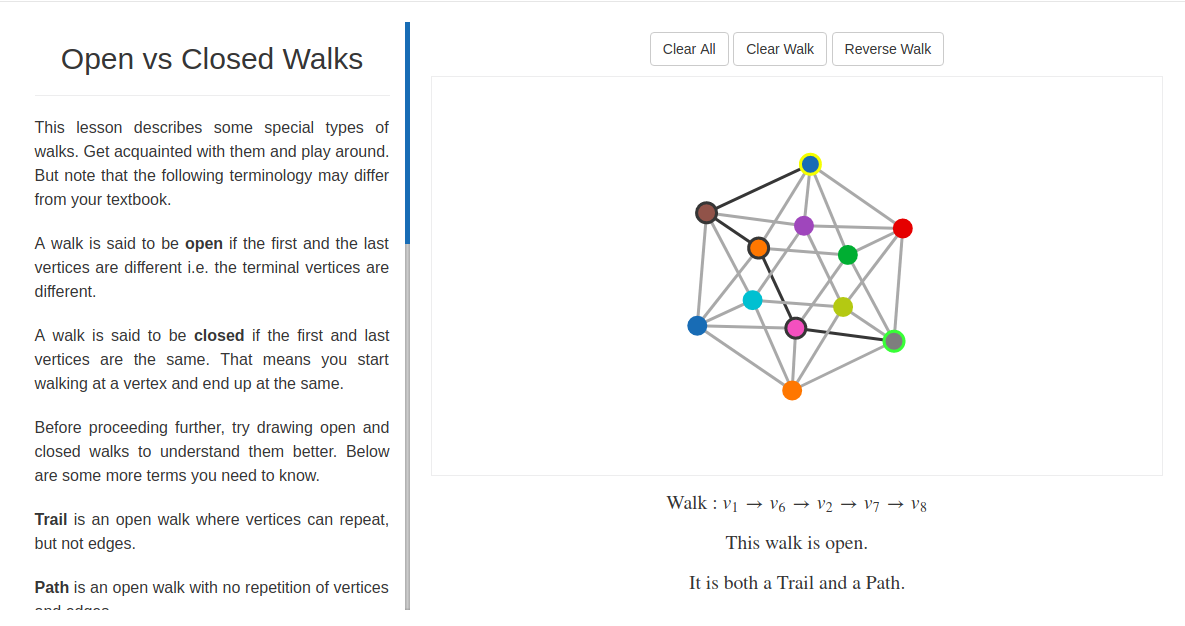
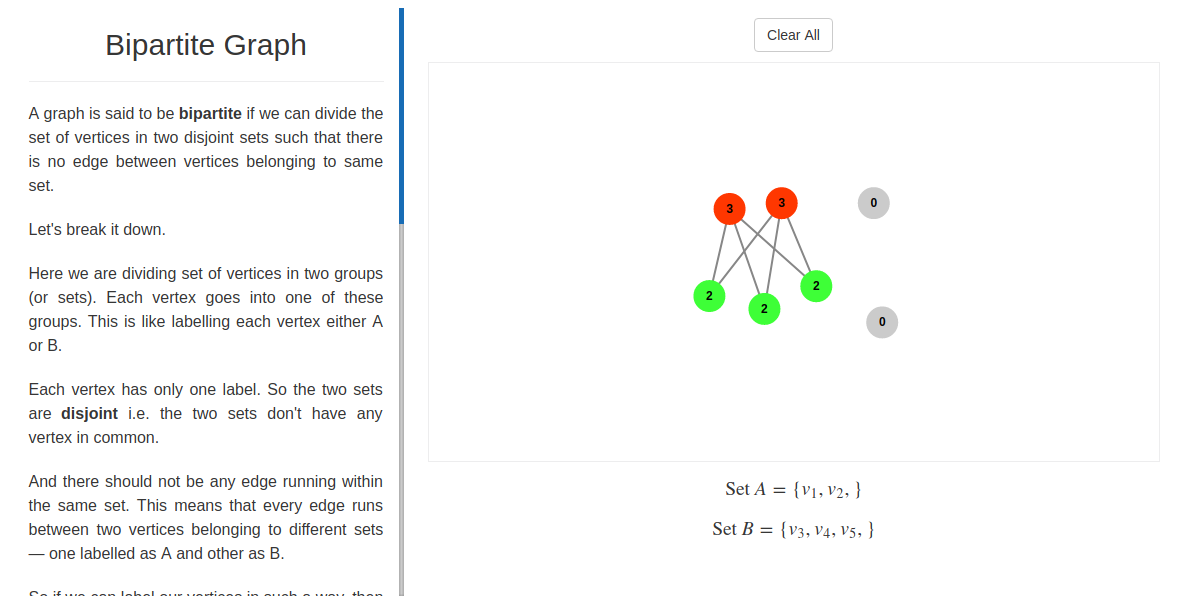
Screenshots:
Note by
Avinash Pandey
3 years, 6 months ago
Easy Math Editor
This discussion board is a place to discuss our Daily Challenges and the math and science related to those challenges. Explanations are more than just a solution — they should explain the steps and thinking strategies that you used to obtain the solution. Comments should further the discussion of math and science.
When posting on Brilliant:
*italics*or_italics_**bold**or__bold__paragraph 1
paragraph 2
[example link](https://brilliant.org)> This is a quote# I indented these lines # 4 spaces, and now they show # up as a code block. print "hello world"\(...\)or\[...\]to ensure proper formatting.2 \times 32^{34}a_{i-1}\frac{2}{3}\sqrt{2}\sum_{i=1}^3\sin \theta\boxed{123}Comments
This is so cool!
Another nice resource for Algorithm Visualization is visualgo.net
Log in to reply
Just checked it. Visualgo is awesome. I think I can take some inspiration from it. Thanks.
I absolutely love it! Enjoyed the interactivity, as well as your explanations. Keep up the good work!
@Avinash Pandey Love it. Your website beautiful and insanely responsive.
Log in to reply
I glad you liked it. Thnx for feedback.
UPDATE: Three new units have been added to the app: - Graph Coloring - k-Colorable Graph - Chromatic Number
Check them out and fill colors in graph representations of icosahedron and rhombic dodecahedron.