Plotting the Mandelbrot Set (Roughly)
Inspired by a recent problem by David Vreken.
The Mandelbrot Set is the set of complex numbers for which the following sequence does not diverge:
I found a divergence sufficiency criterion online:
#
The complex value has a magnitude less than or equal to 2
AND
Any sequence term has a magnitude greater than 2
#
Here were some other possible divergence sufficiency criteria discussed in the solutions section:
#
OR
OR
#
Let's simply assume that these are right, and proceed with the following simulation:
1) Sweep through the complex plane (varying and ).
2) Run 100 iterations of the sequence for each point to test the first divergence criterion
3) Apply the second set of divergence criteria as well
4) Plot points for which the sequence does NOT diverge
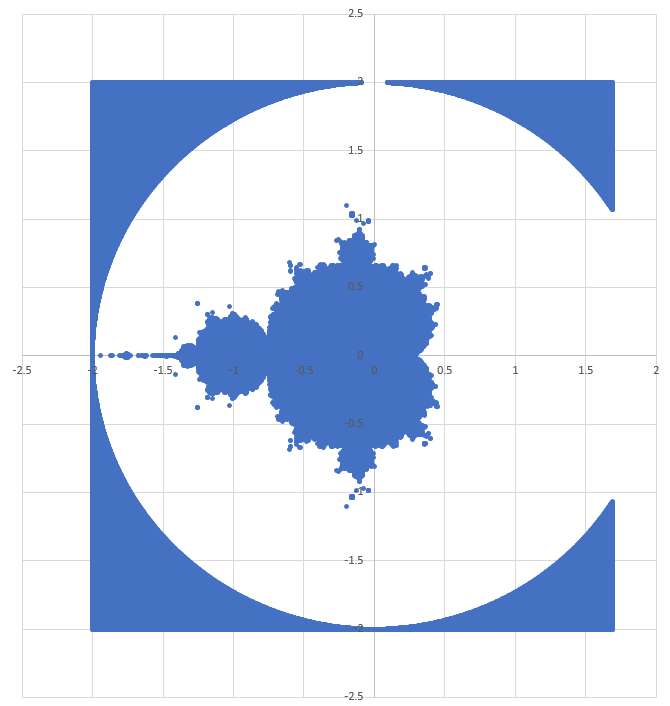
The result is shown below (plotted as an scatter in Excel). Click to enlarge. It looks very much like the picture on the Wikipedia page, except for the anomalous portion on the left side. For some reason, the code didn't detect that those points diverge. Pretty cool, regardless. Code is attached below. Plots are included for both sets of divergence criteria combined (plot 1), and for only the first set (plot 2) (the ones I found online).
Plot 1 - Both sets of divergence criteria combined
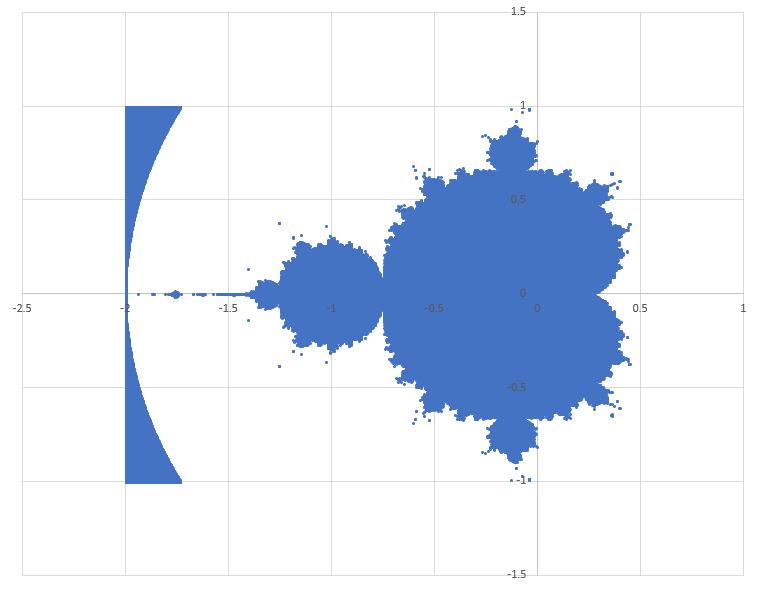
Plot 2 - Only the divergence criterion I found online
This one contains some more extraneous points around the periphery (outside a circle of radius 2).
Code (with full divergence-checking functionality):
import math

Nside = 2000
Nterms = 100

dx = 4.0 / Nside
dy = 4.0 / Nside

x = -2.0

while x <= 2.0:     # real part scan

    y = -2.0

    while y <= 2.0: # imaginary part scan

        c = complex(x,y)  # initialize values

        z = 0.0
        div = 0

        if abs(c) <= 2.0:  # apply first divergence criterion

            j = 0

            while (j <= Nterms) and (abs(z) < 10.0**6.0):

                z = z*z + c

                if abs(z) > 2.0:

                    div = 1

                j = j + 1

        if (y > 1.0) or (y < -1.0) or (x > 1.0):  # apply more divergence criteria

            div = 1

        if div == 0:  # print complex values associated with non-divergent sequences
            print x,y

        y = y + dy

    x = x + dx
Note by
Steven Chase
2 years, 11 months ago
Easy Math Editor
This discussion board is a place to discuss our Daily Challenges and the math and science related to those challenges. Explanations are more than just a solution — they should explain the steps and thinking strategies that you used to obtain the solution. Comments should further the discussion of math and science.
When posting on Brilliant:
*italics*or_italics_**bold**or__bold__paragraph 1
paragraph 2
[example link](https://brilliant.org)> This is a quote# I indented these lines # 4 spaces, and now they show # up as a code block. print "hello world"\(...\)or\[...\]to ensure proper formatting.2 \times 32^{34}a_{i-1}\frac{2}{3}\sqrt{2}\sum_{i=1}^3\sin \theta\boxed{123}Comments
@David Vreken Here's a further exploration of the plotting, and of the effects of applying various divergence criteria
Very nice! It is hard to get a very high resolution fractal that you can zoom into with python however.
When I did this exercise, I used the fragment shader to look at all the pixels or points on the screen in a parallel manner (not serially), and it shaded the outline of the Mandelbrot set quite quickly. If you can zoom in, you can see the "Valley of Seahorses and Elephants", converging into the inner edges of the set.
You can do it as a purely fragment shader render in OpenGL.
Log in to reply
What is a fragment shader?
Log in to reply
The fragment shader program is a type of program that directly programs the GPU of your computer to operate on the "fragments" or collections of pixels of your graphics. Most modern graphics APIs are shader based. You can do really cool "painting" and light effects rendering with the FS, and it's all parallelised by OpenGL so it can run on your GPU.
Log in to reply
Oh, that's nice. One of these days I need to play with that
Log in to reply
Well, fragment shading in GL isn't that necessary unless you want to reduce your program speed a lot and make use of the GPU to make really high res stuff, but it's just cool. You can even do really cool animations for physics. Sometimes I try to do Runge Kutta on the fragment shader and it runs super fast and precise.
With your level of logical ability in programming I doubt you'll take much time to pick it up. It took me a while, but I don't think it'll take you more than a few days!