Self Referential Formula, Plot your name!
Hello Guys;
I wrote a note before that about a website that where you can graph your name.
Today I'll present to you this formula :
its name is Tupper's Self Referential Formula and the best part of this is that when we plot it in certain range the graph is the formula itself
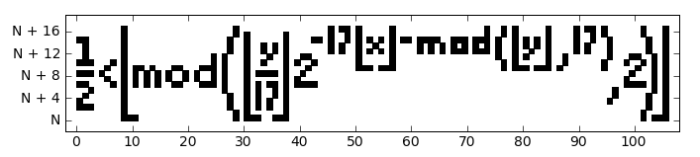
Amazing isn't it and the number is equal to:
1 | |
That's not everything. The images produced by Tupper’s formula are black and white pictures 106 pixels wide by 17 pixels high. If you take a 106 × 17 grid and place a 1 in the squares you want to be black and a 0 in the squares you want to be white, rotating the image and reading the digits off left to right, working down the image, will give you a 1,802-digit binary number. If you convert that number into base-10, then multiply it by 17, you get the value \(N).
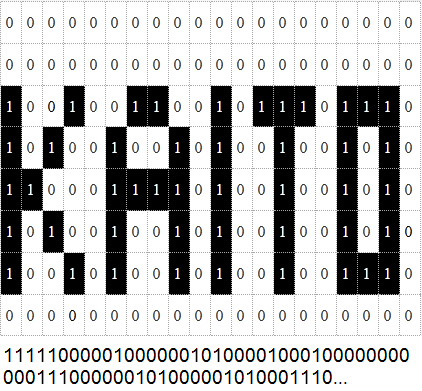
like if we want to plot the name \(KAITO\) we do this:
and this Python code allow you to plot the formula for any integer :
1 2 3 4 5 6 7 8 9 10 11 12 13 14 15 16 17 18 19 20 21 22 23 24 25 26 27 28 29 30 31 32 33 34 35 36 37 38 39 40 41 42 43 44 45 46 47 48 | |
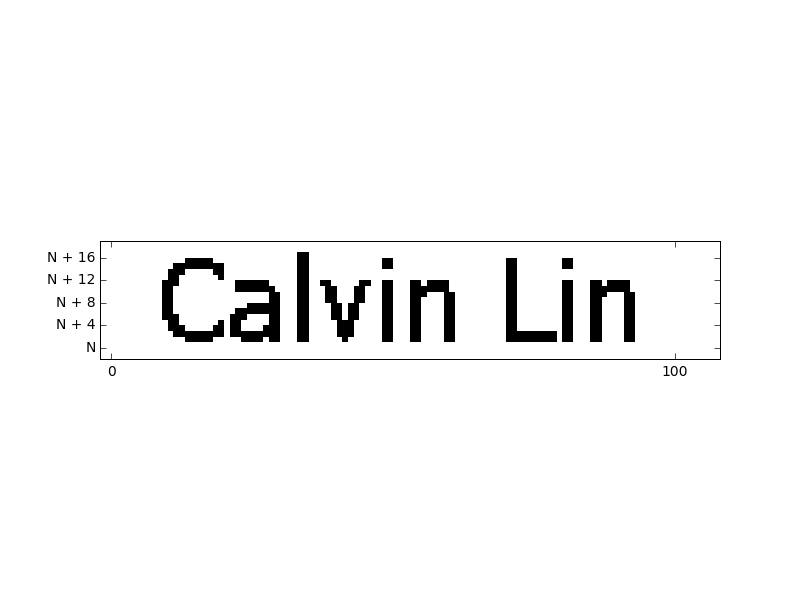
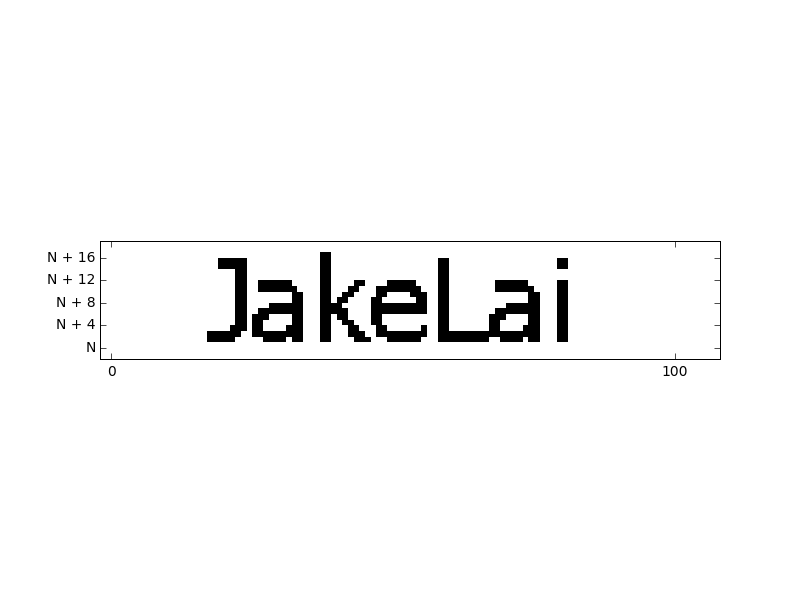
and Finally i calculate the of some names of brilliant's members those who amazed me with their Ideas Problems and Solutions, Hope they don't Mind
starting with brilliant

@Calvin Lin
@Pi Han Goh

@Jake Lai
@Chew-Seong Cheong

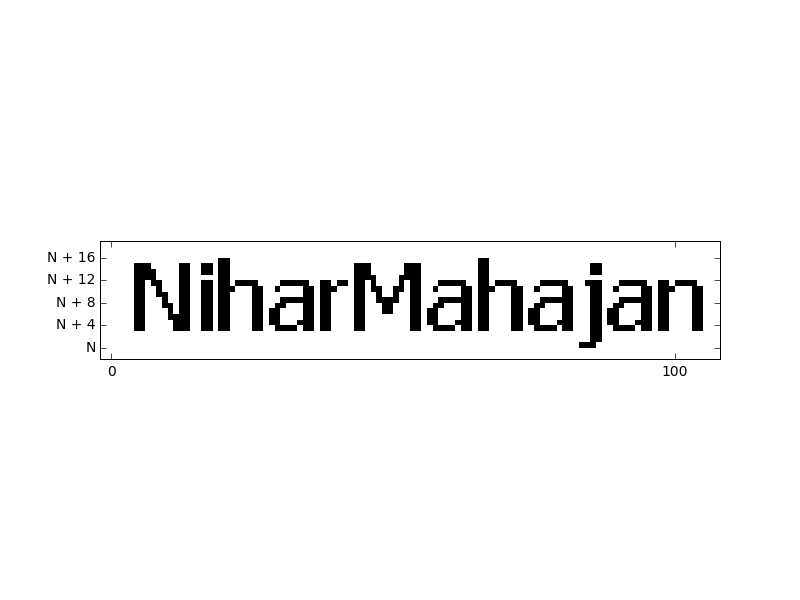
@Nihar Mahajan
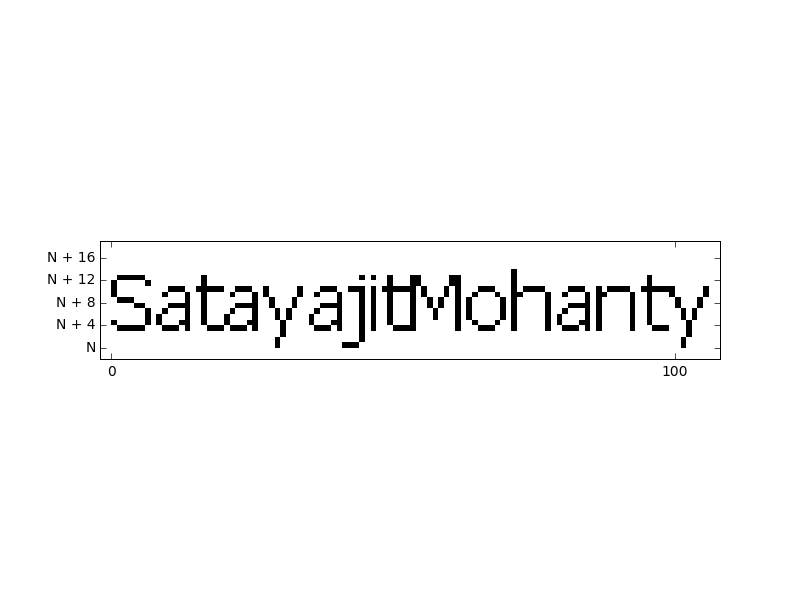
@Satyajit Mohanty
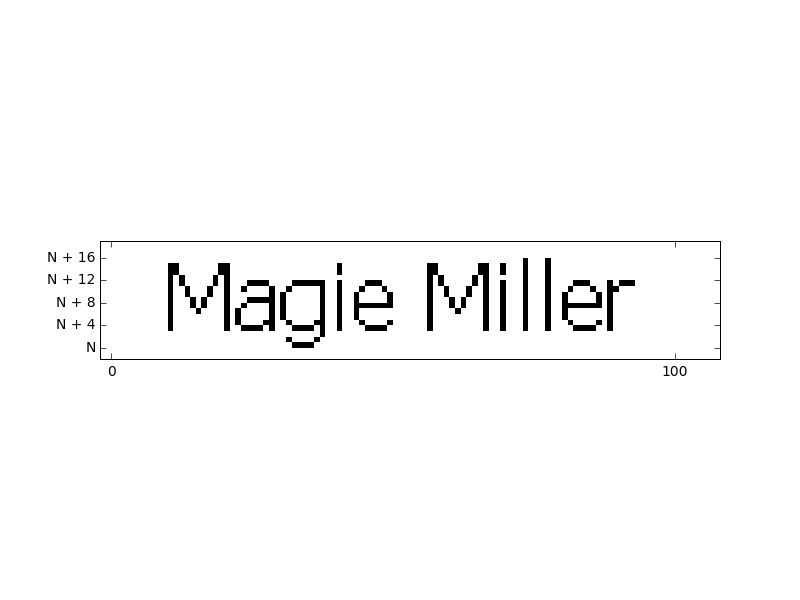
@Maggie Miller
For the numbers for every name you can find them Here
feel free to comment anything any suggest... See you another time ;)
Note by
Abdeslem Smahi
5 years, 10 months ago
Easy Math Editor
This discussion board is a place to discuss our Daily Challenges and the math and science related to those challenges. Explanations are more than just a solution — they should explain the steps and thinking strategies that you used to obtain the solution. Comments should further the discussion of math and science.
When posting on Brilliant:
*italics*or_italics_**bold**or__bold__paragraph 1
paragraph 2
[example link](https://brilliant.org)> This is a quote# I indented these lines # 4 spaces, and now they show # up as a code block. print "hello world"\(...\)or\[...\]to ensure proper formatting.2 \times 32^{34}a_{i-1}\frac{2}{3}\sqrt{2}\sum_{i=1}^3\sin \theta\boxed{123}Comments
I saw this on Numberphile
Log in to reply
Yes they made a video about i think He was Matt Parker who made it
Log in to reply
Yeah matt parker it was
Okay, my understanding is that a "self-referential formula" is like a mechanism that builds a replica of itself, i.e., it reproduces. If you have a name, and it's rasterized and converted to a number, how is that self-reproduction? Looking at this from a different direction, suppose I have a class of formulas or algorithms in which to generate a sequence of numbers. Further suppose that we have some quote, say, "I am computed, therefore I am". Is it possible to design a formula or algorithm where it is not obvious how that quote could have been "programmed into it", and yet, somewhere in the sequence of numbers, put in raster form, that quote pops out, thus, "I am computed, therefore I am"? Furthermore, how about if that quote is the actual formula being used to generate it? That was Tupper's feat, which is what makes it so interesting.
Dude , Amazing! SuperLike :)
Log in to reply
Only coz he plotted your name too :P
Jk Great work! @Kaito Einstein
Log in to reply
He plotted my name because I am his friend. Indeed the work is quite amazing and even if my name was not plotted , my opinion would remain unchanged.I hope this changes your view too. :)
Log in to reply
@Nihar Mahajan Tum toh senti ho gye yaar :3
I was just joking man! Each member of the community is everyone's friend. :)
Log in to reply
Nothing sentimental in that. Since you had got the wrong reason ,I just gave the right reason why I posted that comment.
Log in to reply
Okay dude, Relax!
Log in to reply
I am already relaxed (for some time) :)
Log in to reply
Good to know. :)
Calvin Lin Chew-Seong Cheong Maggie Miller Jake Lai Pi Han Goh
Log in to reply
Can you please do it in my name too ? In the comment box !
Log in to reply
ok no problem but it will take some time, maybe after 4 hours :)
Log in to reply
Thanks
Log in to reply
Sorry i was busy with the wiki stuff Here it is and your number
Log in to reply
Great Work , Kaito !
Log in to reply
Thanks :)
Nice. I just found about the function (here's the graph - desmos).
Here's an interesting link - tupper formula