This is a chart of the world record time in the men's 100 meters freestyle, from 1905 to 2010. The x-axis indicates the year when the previous record was broken, and the y-axis indicates the new time taken (in seconds). Times have been decreasing over the years, due to better training techniques and developments in the sport.
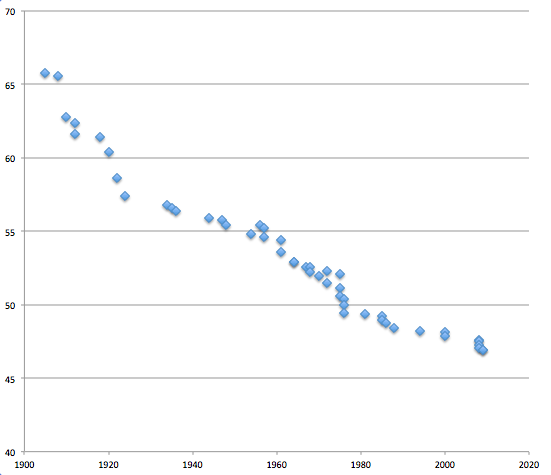
Based on the above data, which of the following would be the best prediction of the world record time for the men's 100 meters freestyle in 2050?
Data: Wikipedia
This section requires Javascript.
You are seeing this because something didn't load right. We suggest you, (a) try
refreshing the page, (b) enabling javascript if it is disabled on your browser and,
finally, (c)
loading the
non-javascript version of this page
. We're sorry about the hassle.
each time difference of 5 seconds takes place in approximately 15 to 20 years...so according to this assumption..the only possible answer is 43 :D
Each time difference of 5 seconds takes place in approximately 15 to 20 years...So according to this assumption..the only possible answer is 43...
But why the time would not go below 40 seconds.
Log in to reply
If u try to fit a linear line following the pattern given, it will show that 2050 corresponds to a value somewhat 43
Log in to reply
Also this is not linear, more like exponential, since then in like year 3000 people would have negative times.
Log in to reply
@William Cui – The years 1920 and 1980 give clean data as 60 and 50. forming a linear equation of those gave me an answer of around 39. I chose 35 hence and the answer was deemed wrong.
Log in to reply
@Soaham Ganguly – no need of a lenear equation dude...cuz the data is not perfect..u need to try and analyze it through your vision..a perfect answer is impossible..only assumption is possible. :D :)
@Soaham Ganguly – I did the regression analysis and came up with answer 35 and I was disappointed.
Mark the blue point at the top left as 'A' and the blue point at the bottom right as 'B'...Then take the radius in a rounder as 'AB' and mark arcs at the top by keeping the point at 'A' and 'B' respectively...obviously they will cross each other..name the intersected point as 'C'..keep the rounder on 'C' and take radius 'BC' and continue the arc...u will see that according to the given data the arc will not cross the 40 second mark and hence a 40 second time is not possible :D :)
When x=1980, then y=49. When x=2010, then y=46. (46-49)/(2010-1980)=-3/30=-1/10 So, world record time decreases at a rate of 1 second for 10 years. Assuming further that the relationship between y and x will be linear, when x will be equal 2040, then y will be equal 43. Accordingly when x=2050, then y=42. The closest number to 42 of the responses is 43. Therefore, possible answer is 43, although I believe that the time a world record in 2050 will be about 42, and not 43 seconds.
By extrapolate the graph we can predict it easily.
I did the same. The beauty of more intuitive solutions is great.
wat is extrapolate ???
Log in to reply
extrapolating means extending the curve logically sometimes assuming curve is linear,parabolic etc
The graph has already crossed 55, so the fist option is logically out. From the graph, it is also evident that the latest record is pretty much already at 47. Assuming that this trend continues to reduce the time, 47 cannot be the answer as well. Now, if we analyze a bit more carefully from 1980 to 2020 (in 40 years), the speed has decreased by about 5 m/s. (assuming that by 2020, speed reaches 45). 35 seems an impossible choice since speed can't reduce by 10m/s by 2050 (In 30 years. And if we apply our brain power, we can reveal the truth that 30 is smaller than 40). Thus, 43 is logically the best answer
Basically, you just have to read the graph off. You can use the multiple choice options to help. The trend is that record times are decreasing, and you therefore, rule out the two highest options. Then, by looking at the increase in the 40 years between 1970 and 2010, you can see it has dropped by about 5. However there is a slight curve on the graph - so 43 seems like a good answer. It may also help to print off the graph and draw a curve of best fit.
form past few years, there isn't any drastic change in the timings of the champions but is greater 45 secs. so i the nearing future the bench mark would be close to 45 but will definitely be less than 45 secs. so it would be about 43 secs.
In last 105 years run time was reduced by 18 sec, by unitary method we can calculate the run time reduction in 40 years, that is almost 7 sec. thus the time taken in 2050 might be 47 - 7 = 40 sec
The data is discrete and I chose to take a long interval for a linear pattern. From 1920 to 2020, the decrease is 62-47=15 (roughly). The percentage in decrease is 15%. For the next 30 years from 2020, the decrease would be 47-(15/100)* 30=4.5. Hence the best prediction would be 43 which is the nearest to 42.5!
I took the data from wikipedia and did some regression
exponential -> 1.81E4 * e^-2.97E-3 = 41.1 s
power -> y = 7.77E20 * x^-5.82 = 41.3 s
Problem Loading...
Note Loading...
Set Loading...
2010 corresponds to a value approximately 47 and therefore it can be predicted that in 2050 the record should be less than 45 and greater than 40 according to the plot and hence 43 :)