Checkers, Anyone?
 The graph of
csc
(
x
)
csc
(
y
)
=
ϕ
forms a bunch of squares and circles. The area of one of these circles is most nearly which of the following?
Remark: ϕ = 2 1 + 5
This section requires Javascript.
You are seeing this because something didn't load right. We suggest you, (a) try
refreshing the page, (b) enabling javascript if it is disabled on your browser and,
finally, (c)
loading the
non-javascript version of this page
. We're sorry about the hassle.
4 solutions
AMAZING!
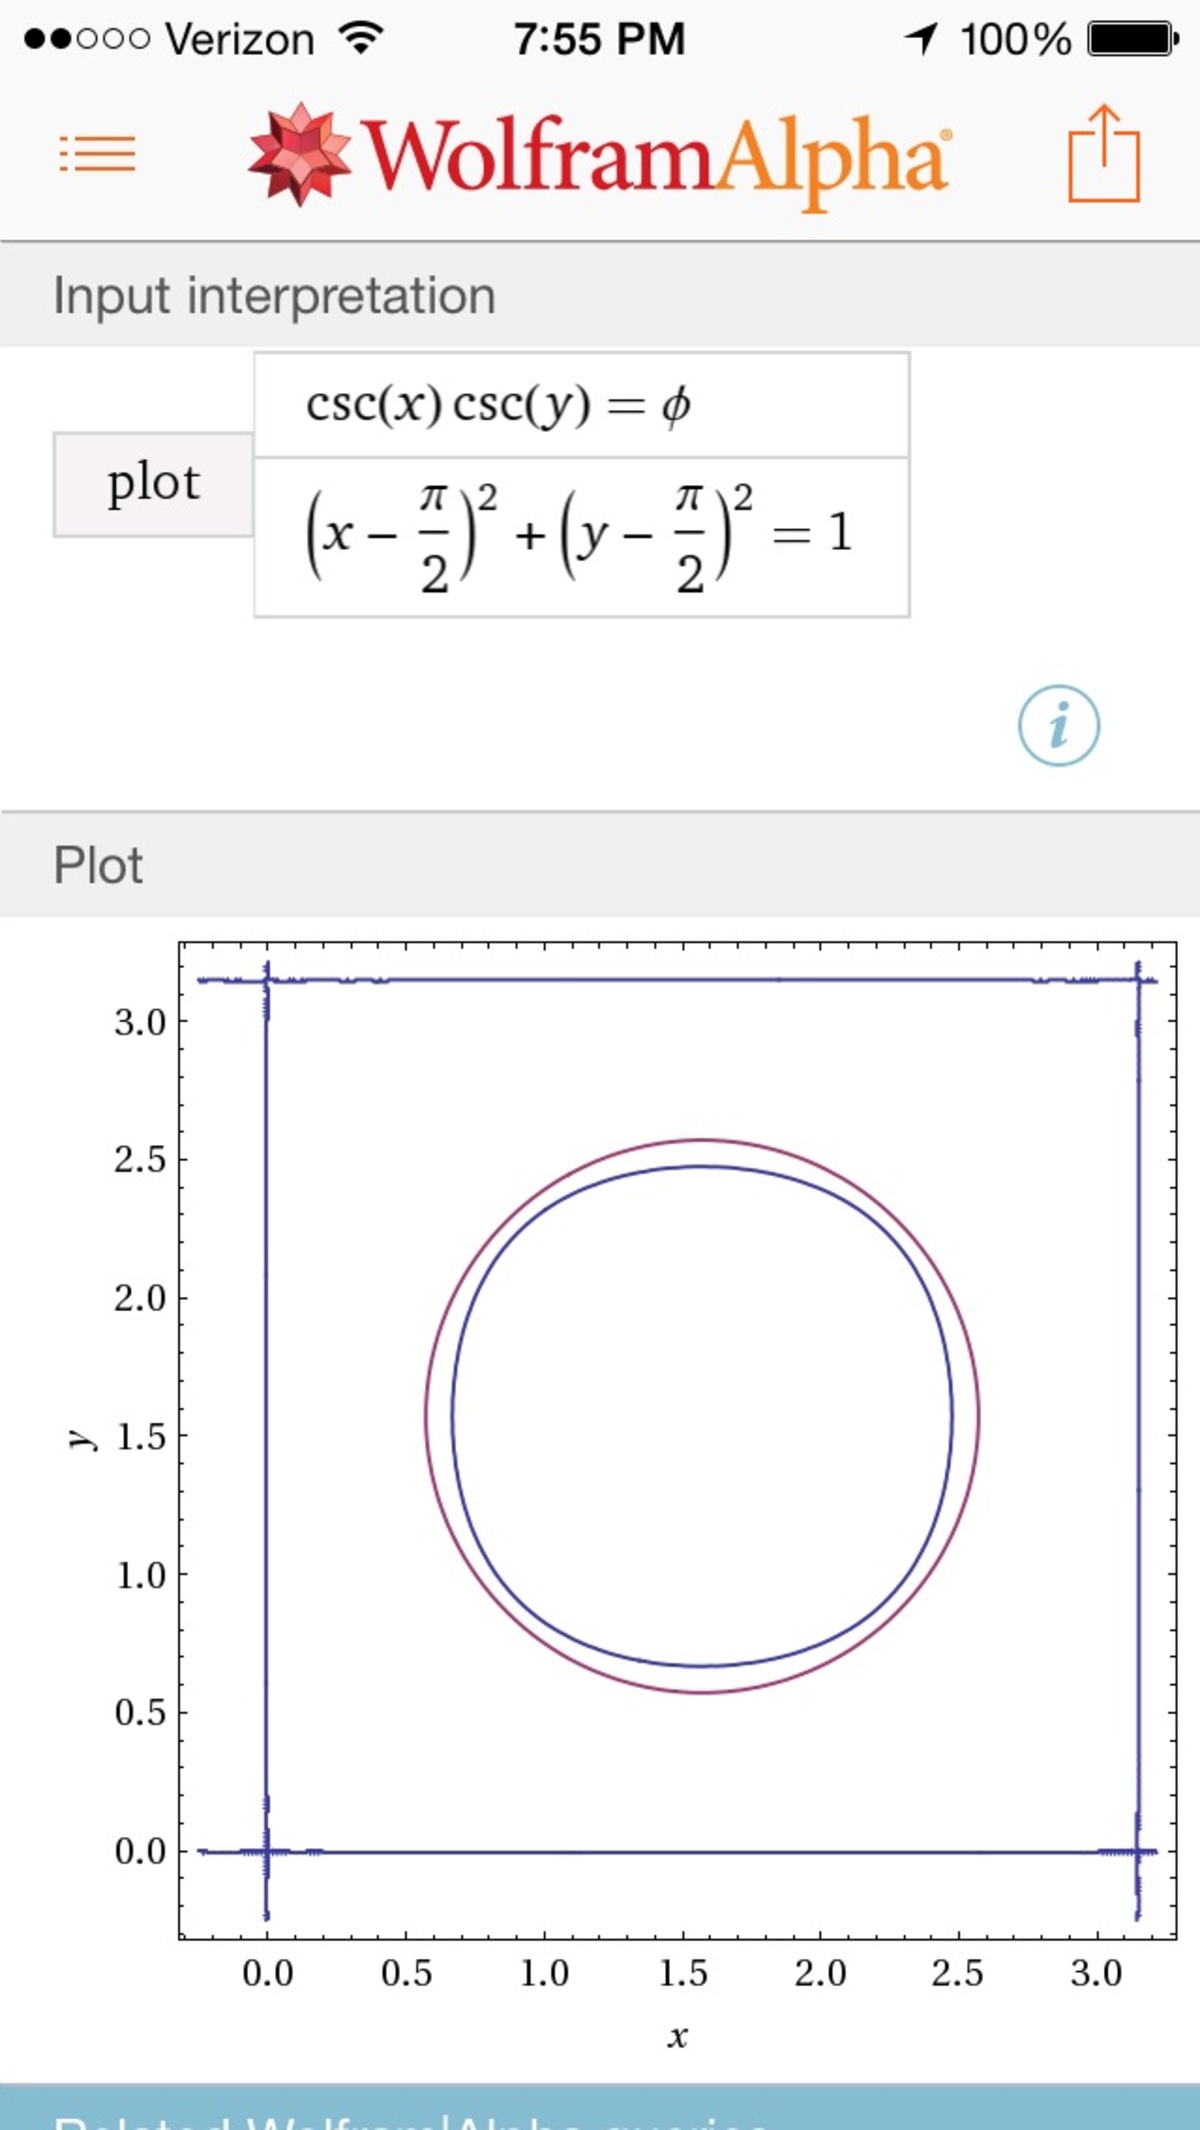
But what about the " square grids " surrounding the circles? How are they formed?
And why do they disappear if we input the absolute sign ?
Log in to reply
The square grids explanation is easy. We already know that the square grid represents the parts where csc x csc y " = " ∞ . Thus, it makes sense that as k gets larger and larger, then csc x csc y = k would approximate the square grid.
The reason why they "disappear" is that they shouldn't have been there in the first place! As Trevor stated, "the lines are actually undefined areas". Unfortunately, I don't know too much about Wolfram's graphing software, to be able to explain when they decide to draw in these asymptotes. It's like saying "How come in y = x − 1 1 , we get a vertical line at x = 1 ?".
Log in to reply
So basically in the actual graph, the lines are not there. If you wanted the lines to be in the graph, the equation you could use would be: ( sin ( x ) sin ( y ) − ϕ 1 ) sin ( x ) sin ( y ) = 0 .
If you are talking about the ones that show up on the graph, I believe that those are undefined areas. Since csc ( x o r y ) = ∞ there. Idk why it's graphed.
Calculating numerically I got the area as 2 . 6 7 5 1
Log in to reply
What method did u use?
Log in to reply
I'll leave you with this , I think you can figure this out.
The grand master never fails @Pi Han Goh
I'm relatively good with understanding how a function will look like when graphed but I'm having a little trouble with this one. I can see where the circular-ness comes from, y = π / 2 yields the max and minimum values of x ≈ π / 2 ± 1 . But it's of course slightly less than that as the power approaces gigantic numbers if ( x − π / 2 ) > 1
Since there are no odd powers, they will only get bigger.
We'll focus on the region that is centered at O = ( 2 π , 2 π ) .
First find the radius r 1 of the largest circle centered at O contained inside the region. When x = 2 π , the smallest possible positive value of y is sin − 1 ( ϕ 1 ) . So the radius of the largest circle centered at O contained entirely within our region is r 1 = 2 π − sin − 1 ( ϕ 1 ) .
Now find the radius r 2 of the smallest circle centered at O that contains the region. When x = y , the equation becomes csc 2 ( x ) = ϕ , and the smallest possible positive solution is ( sin − 1 ( ϕ 1 ) , sin − 1 ( ϕ 1 ) ) . So r 2 = ( 2 π − sin − 1 ( ϕ 1 ) ) 2 .
Since π r 1 2 ≈ 2 . 5 7 and π r 2 2 ≈ 2 . 7 9 , we're looking for an answer in that range. Of the options, ϕ e π 2 is the only one.
Very creative. I never thought to use the average. I think that the area of this figure is almost the exact average of the two. ϕ e π 2 ≈ 2 . 6 6 8 . And I think this is just a tad too small
Log in to reply
very beautiful and creative case , it is rather more interesting than absurd!!


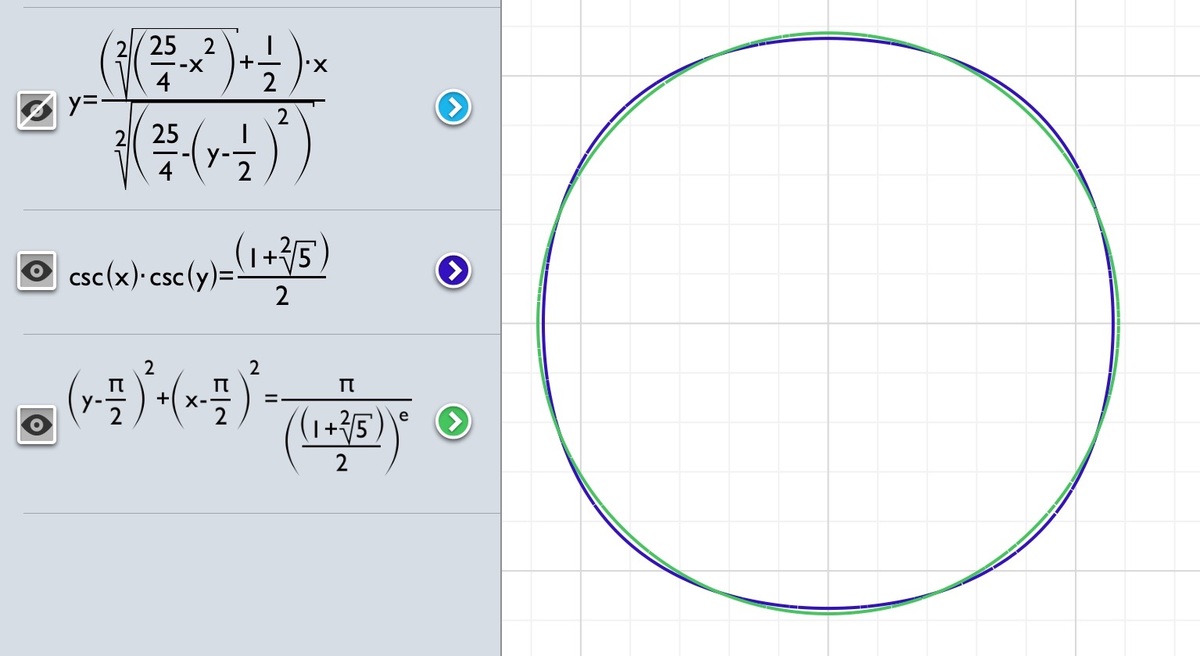
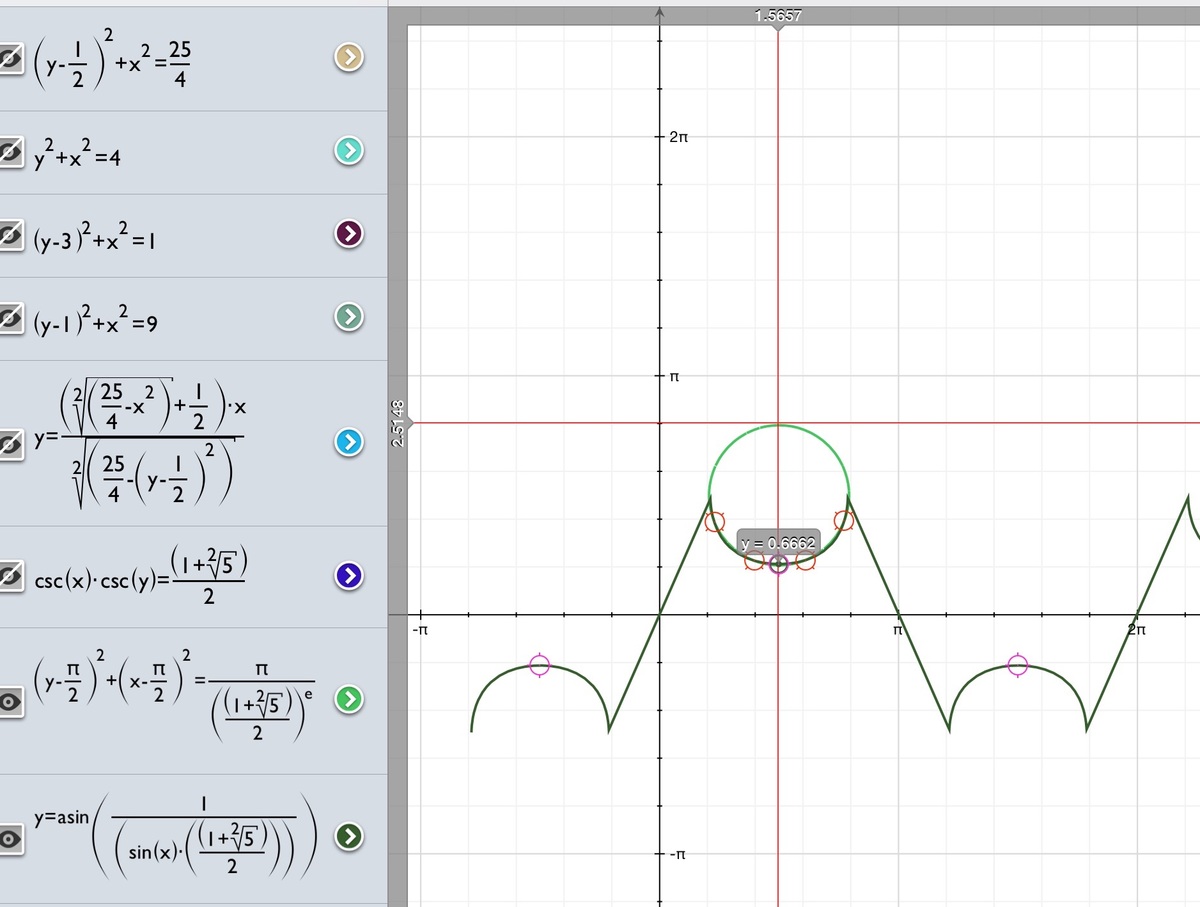
Dunno how to solve this without using a graph. The circle is what I approximate the area to, The integral is stupid too, wolfram gave up tryna compute it. In the picture above, the little circles with dots in them are intersections of the real graph with the approximate circle
Does anyone know how to do the integral? Or is it just too ugly.
This reminds me of the graph sin ( x + y ) sin ( x − y ) = k Where k is between 1 and 0.
btw I got something close to 2 . 6 7 5 1 using numerical method.
By approximating circles without the aid of a computer, I got the radius of each circle as 2 ( π − 2 sin − 1 ( 1 + 5 2 ) ) which gives the area as 2 . 5 7 0 5 2 .
If anybody is able to evaluate this , this problem can be solved to the exact value.
I'm still working on the integral.
I don't know how to prove the fact that "OMG CIRCLES EVERYWHERE", but here's my attempt (assuming they are circles, because they look like one, not because they are one)
I'm going to approximate the area to 4 π ⋅ ( π − 2 arcsin ( 2 5 − 1 ) ) 2
csc y = sin x ⋅ 2 1 + 5 , differentiate w.r.t x , we get cos x = 0 ⇒ sin y = 1 + 5 2
So the minimum and maximum value of y is arcsin ( 1 + 5 2 ) and π − arcsin ( 1 + 5 2 )
And thus the diameter of this circle is π − 2 arcsin ( 1 + 5 2 ) which gives the above result. We just need to find the choice which is in the range of that answer, 2 to 3 . So it's π 2 / ϕ e
EDIT: for some reason: WA gave an answer closer to π .
Log in to reply
Log in to reply
Bonus question: why does it look so much like a circle?
Log in to reply
@Pi Han Goh – I have done nothing but think about this for the past half hour while in the bathroom, eating dinner, and showering. I still have absolutely no idea why.
Log in to reply
@Trevor Arashiro – Requesting grandmaster @Calvin Lin !
Log in to reply
@Pi Han Goh – If csc ( x ) csc ( y ) = z . Then the smaller z is, the closer to a circle the function becomes. As z approaches infinity, it becomes almost a perfect square.
@Pi Han Goh – It is more like an elliptical graph x^n+y^n = 1 where n is a natural number, as you increase the n the more the hyperellipse tends to become a square. That's what i kinda think the situation is here.
Try plotting ∣ csc x csc y ∣ = ϕ . It even has circles where the original was empty!
I also did it by using graph and radius approximation.And i also think that they are not exactly circles.
I used this approach, but I'm sure it's wrong because the value I get is too far from the right answer (although the right answer was still the closest value to my answer). Does anybody know what's the problem? Let us think about the function z = s i n ( x ) s i n ( y ) the plot of this function looks like alternating mountains and valleys. If we take the cross section of that for a certain value of z , we obtain the circles shown in the picture. For any value of z , the center of those circles should be on the point ( x , y ) that gives us the maximum z for each mountain/valley. Looking at the partial derivative of the function, it's easy to see that this happens first at ( 2 π , 2 π ) . Now, using this in the function given in the problem, we can see for which values of x it is true that s i n ( x ) s i n ( y ) = ϕ 1 , when y = 2 π , and the radius of the circle will be 2 π − x . Doing that we get that x = a r c s i n ( ϕ 1 ) and the area is about 2 . 5 7 .

This solution doesn't explain how to calculate the area, but instead focuses on why we tend to get circles.
Here's the best explanation that I can come up with
1) Since csc ( x + 2 π ) = csc x , it suffices to look at the the region that 0 ≤ x ≤ 2 π . Since csc x csc y > 0 , we will look at 0 ≤ x , y ≤ π .
2) We want to understand why the circles seem to form about the points ( 2 π , 2 π ) . To do so, we will simply take the Taylor expansion about that point. This gives us:
( 1 + 2 1 ( x − 2 π ) 2 + 2 4 5 ( x − 2 π ) 4 + … ) ( 1 + 2 1 ( y − 2 π ) 2 + 2 4 5 ( y − 2 π ) 4 + … ) = ϕ
Observe that the RHS only has positive coefficients and even exponents, hence is an increasing function on x ≥ 2 π . (It is also an "increasing function" on x ≤ 2 π if we trace our steps backwards, but that doesn't really matter ).
3) For small values of a , b , and k ≳ 1 the solution to
( 1 + a 2 ) ( 1 + b 2 ) = k
looks very much like the circle a 2 + b 2 = ( k − 1 ) . This is obvious, because we are dropping the "very small term of a 2 b 2 ".
Thus, this explains why with ϕ , we obtain the circles.